Exam 2: Linear Models, Equations, and Inequalities
Exam 1: Functions, Graphs, and Models; Linear Functions306 Questions
Exam 2: Linear Models, Equations, and Inequalities212 Questions
Exam 3: Quadratic, Piecewise-Defined, and Power Functions261 Questions
Exam 4: Additional Topics With Functions299 Questions
Exam 5: Exponential and Logarithmic Functions304 Questions
Exam 6: Higher-Degree Polynomial and Rational Functions262 Questions
Exam 7: Systems of Equations and Matrices196 Questions
Exam 8: Special Topics in Algebra265 Questions
Select questions type
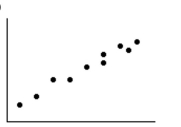
Use the data shown in the scatter plot to determine whether the data should be modeled by a linear function.
-
(Multiple Choice)
4.8/5  (33)
(33)
Translate the sentence to an algebraic inequality.
-If the formula P 2.57 can be used to predict the average price of a theater ticket after 1945, for what years will the average theater ticket price be at least 43 dollars? (Y is the actual year.)
(Multiple Choice)
4.8/5 (34)
Solve the system of equations by elimination, if a solution exists.
-
(Multiple Choice)
4.9/5 (26)
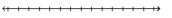
Solve the inequality and draw a number line graph of the solution.
-
(Multiple Choice)
4.9/5 (34)
The table below gives the quantity of a product demanded and the quantity supplied for various prices. Solve the
problem.
-Find the market equilibrium price. Price (dollars) Quantity Demanded Quantity Supplied 100 250 0 120 210 40 140 170 80 160 130 120 180 90 160
(Multiple Choice)
4.9/5 (39)
Translate the sentence to an algebraic inequality.
-The equation y can be used to determine the approximate profit, y in dollars, of producing x items. How many items must be produced so the profit will be at least $2937?
(Multiple Choice)
4.8/5 (36)
Translate the sentence to an algebraic inequality.
-DG's Plumbing and Heating charges $50 plus $60 per hour for emergency service. Bill remembers being billed just over $400 for an emergency call. How long to the nearest hour was the plumber at Bill's house?
(Multiple Choice)
4.9/5 (31)
Write the best-fit linear model for the data.
-Two different tests are designed to measure employee productivity and dexterity. Several employees are randomly selected and tested with these results. Find the linear function to model this data. Productivity 23 25 28 21 21 25 26 30 34 36 Dexterity 49 53 59 42 47 53 55 63 67 75
(Multiple Choice)
4.8/5 (35)
To find the number of units that gives break-even for the product, solve the equation R ound your answer to the
nearest whole unit.
-Mardi received an inheritance of $50,000. She invested part of it at 12% and the rest at 11%. Her total annual income from the investments was $5900. Find the amount invested at 12%.
(Multiple Choice)
4.8/5 (33)
Translate the sentence to an algebraic inequality.
-Suppose that the sales of a particular brand of appliance satisfy the relationship , where represents the number of sales in year , with corresponding to 1990 . For what years will sales be between 1960 and 2320 ?
(Multiple Choice)
4.9/5 (42)
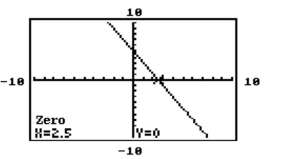
The graph of a certain function and the zero of that function is given. Using this graph, find a) the -intercept of the graph of and b) the solution to the equation .
-
(Multiple Choice)
4.9/5 (32)
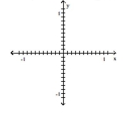
Construct a scatter plot of the data in the table.
- 0.75 0.86 0.33 0.25 -0.12 0.97 0.71 -0.05 0.57 0.1 0.72 0.12 -0.91 0.54 0.1 0.13
(Multiple Choice)
4.9/5 (31)
Without graphing, determine whether the following data set is exactly linear, approximately linear or nonlinear.
- Height (inches) 57 60 72 59 63 65 66 68 61 Time (seconds) 32.9 40.1 35.7 41.8 47.4 37.3 39.1 41.5 32.8
(Multiple Choice)
4.7/5 (26)
Without graphing, determine whether the following data set is exactly linear, approximately linear or nonlinear.
- Foot Length () 25 26 28 29 30 31 32 33 37 Forearm Length () 24 25 28 30 31 30 31 33 37
(Multiple Choice)
4.7/5 (29)
Solve the equation using graphical methods. Round to the nearest thousandth when appropriate.
-
(Multiple Choice)
4.8/5 (29)
Filters
- Essay(0)
- Multiple Choice(0)
- Short Answer(0)
- True False(0)
- Matching(0)