Exam 2: Linear Models, Equations, and Inequalities
Exam 1: Functions, Graphs, and Models; Linear Functions306 Questions
Exam 2: Linear Models, Equations, and Inequalities212 Questions
Exam 3: Quadratic, Piecewise-Defined, and Power Functions261 Questions
Exam 4: Additional Topics With Functions299 Questions
Exam 5: Exponential and Logarithmic Functions304 Questions
Exam 6: Higher-Degree Polynomial and Rational Functions262 Questions
Exam 7: Systems of Equations and Matrices196 Questions
Exam 8: Special Topics in Algebra265 Questions
Select questions type
Without graphing, determine whether the following data set is exactly linear, approximately linear or nonlinear.
- x 1 2 3 4 5 y 9 13 19 27 37
(Multiple Choice)
4.8/5  (35)
(35)
Solve the system of equations by elimination, if a solution exists.
-
(Multiple Choice)
4.8/5 (30)
To find the number of units that gives break-even for the product, solve the equation R ound your answer to the
nearest whole unit.
-Roberto invested some money at 8%, and then invested $2000 more than twice this amount at 10%. His total annual income from the two investments was $3000. How much did he invest at 10%?
(Multiple Choice)
4.7/5 (33)
Solve the inequality and draw a number line graph of the solution.
-
(Multiple Choice)
4.8/5 (27)
Solve the equation for y.
-The temperature of water in a certain lake on a day in October can be determined by using the model where x is the number of feet down from the surface of the lake and y is the Celsius temperature of the water at that depth. Based on this model, how deep in the lake is the water 8 degrees? Round
To the nearest foot.
(Multiple Choice)
4.7/5 (34)
Solve the equation for y.
-The temperature, t, in degrees Fahrenheit, of water being heated is where m is the number of minutes since heating began. How long will it take for the temperature of the water to reach 70 degrees Fahrenheit?
(Multiple Choice)
4.9/5 (34)
Write the best-fit linear model for the data.
-The paired data below consist of the costs of advertising (in thousands of dollars) and the number of products sold (in thousands). The linear model for this data is , where is the cost of advertising (in thousands of dollars) and is number of products sold (in thousands). Use this model to predict the number of products sold (in thousands) if the cost of advertising is .
Cost 9 2 3 4 2 5 9 10 Number 85 52 55 68 67 86 83 73
(Multiple Choice)
4.9/5 (40)
Solve the inequality and draw a number line graph of the solution.
-
(Multiple Choice)
4.9/5 (39)
Solve the inequality graphically. Give the solution in interval notation.
-Use the intersection method to solve
(Multiple Choice)
4.7/5 (23)
To find the number of units that gives break-even for the product, solve the equation R ound your answer to the
nearest whole unit.
-A manufacturer has total revenue given by the function and has total cost given by , where is the number of units produced and sold.
(Multiple Choice)
4.8/5 (36)
Construct a scatter plot of the data in the table.
- x 20 23 -18 3 -23 -10 y -89 -43 32 -48 68 -8
(Multiple Choice)
4.8/5 (30)
Write the best-fit linear model for the data.
-The ages and lengths of several animals of the same species are recorded in the following table: Age (months) Length (inches) 12 9 15 12 17 20 21 21 26 24 28 27 32 35 38 40 41 40
\text { Find and then use a linear model to predict the length of a } 35 - \text { month-old animal. }
\end{array}\]
(Multiple Choice)
4.9/5 (39)
To find the number of units that gives break-even for the product, solve the equation R ound your answer to the
nearest whole unit.
-The demand for a certain product is given by p , where p is the price in dollars and q is the quantity demanded or supplied at price p. Find the price at which the quantity
Demanded equals the quantity supplied.
(Multiple Choice)
4.7/5 (41)
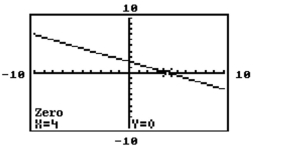
The graph of a certain function and the zero of that function is given. Using this graph, find a) the -intercept of the graph of and b) the solution to the equation .
-
(Multiple Choice)
5.0/5 (34)
Provide an appropriate response.
-A set of data consists of the number of years that applicants for foreign service jobs have studied German and
the grades that they receive in a proficiency test in that language. The following linear model is obtained: , where x represents number of years of study and y represents grade in test. What does the slope
of the model represent in terms of the grades on the test?
(Essay)
4.7/5 (40)
Find the linear function that is the best fit for the given data. Round decimal values to the nearest hundredth, if
necessary.
- x 10 20 30 40 50 y 3.9 4.6 5.4 6.9 8.3
(Multiple Choice)
4.9/5 (37)
Filters
- Essay(0)
- Multiple Choice(0)
- Short Answer(0)
- True False(0)
- Matching(0)