Exam 3: Polynomial and Rational Functions
Exam 1: Equations and Inequalities425 Questions
Exam 2: Functions and Graphs359 Questions
Exam 3: Polynomial and Rational Functions532 Questions
Exam 4: Exponential and Logarithmic Functions270 Questions
Exam 5: Trigonometric Functions386 Questions
Exam 6: Analytic Trigonometry226 Questions
Exam 7: Additional Topics in Trigonometry264 Questions
Exam 8: Systems of Equations and Inequalities288 Questions
Exam 9: Matrices and Determinants152 Questions
Exam 10: Conic Sections and Analytic Geometry228 Questions
Exam 11: Sequences, Induction, and Probability304 Questions
Exam 12: Prerequisites: Fundamental Concepts of Algebra409 Questions
Select questions type
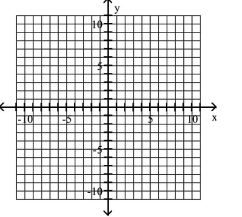
Use the graph of the rational function shown to complete the statement.
-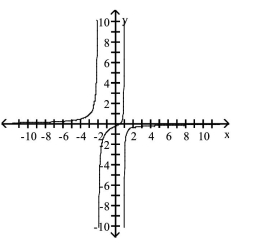 As
As
(Multiple Choice)
4.9/5  (39)
(39)
Choose the one alternative that best completes the statement or answers the question.
Use the vertex and intercepts to sketch the graph of the quadratic function.
-
(Multiple Choice)
4.8/5 (29)
Find a rational zero of the polynomial function and use it to find all the zeros of the function.
-
(Multiple Choice)
4.9/5 (43)
Use Descartes's Rule of Signs to determine the possible number of positive and negative real zeros for the given
function.
-
(Multiple Choice)
4.9/5 (27)
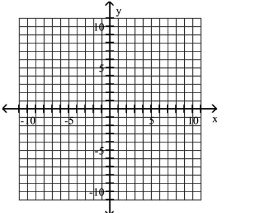
Use the graph of the rational function shown to complete the statement.
-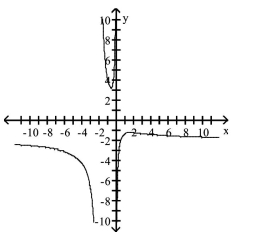 As ?
As ?
(Multiple Choice)
4.8/5 (48)
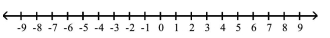
Solve the polynomial inequality and graph the solution set on a number line. Express the solution set in interval
notation.
-
(Multiple Choice)
4.8/5 (44)
Choose the one alternative that best completes the statement or answers the question.
Use the vertex and intercepts to sketch the graph of the quadratic function.
-
(Multiple Choice)
4.7/5 (41)
Use the Leading Coefficient Test to determine the end behavior of the polynomial function. Then use this end
-
(Multiple Choice)
4.8/5 (39)
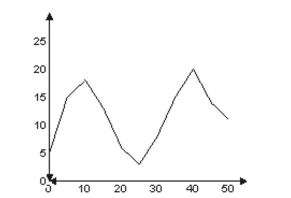
Determine the maximum possible number of turning points for the graph of the function.
-Suppose that a polynomial function is used to model the data shown in the graph below. For what intervals is the function increasing?
(Multiple Choice)
4.9/5 (30)
Solve the problem.
-In one U.S. city, the quadratic function models the median, or average, age, , at which men were first married x years after 1900 . In which year was this average age at a minimum? (Round to the nearest year.) What was the average age at first marriage for that year? (Round to the nearest tenth.)
(Multiple Choice)
4.8/5 (38)
Choose the one alternative that best completes the statement or answers the question.
Use the vertex and intercepts to sketch the graph of the quadratic function.
-
(Multiple Choice)
4.8/5 (23)
Find an nth degree polynomial function with real coefficients satisfying the given conditions.
- , and are zeros;
(Multiple Choice)
4.8/5 (44)
Solve the problem.
-The owner of a video store has determined that the profits of the store are approximately given by , where is the number of videos rented daily. Find the maximum profit to the nearest dollar.
(Multiple Choice)
4.8/5 (37)
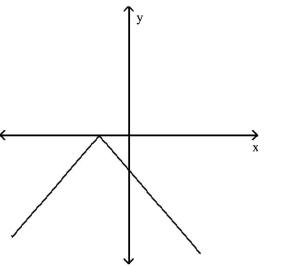
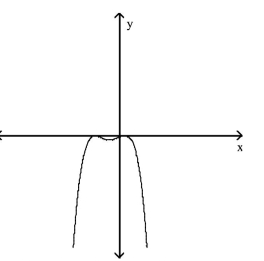
Determine whether the graph shown is the graph of a polynomial function.
-
(Multiple Choice)
4.8/5 (40)
Find the axis of symmetry of the parabola defined by the given quadratic function.
-
(Multiple Choice)
4.7/5 (35)
Determine whether the graph shown is the graph of a polynomial function.
-
(Multiple Choice)
5.0/5 (34)
Filters
- Essay(0)
- Multiple Choice(0)
- Short Answer(0)
- True False(0)
- Matching(0)