Exam 30: Selected Topics in Decision Making
Exam 2: Data20 Questions
Exam 3: Surveys and Sampling26 Questions
Exam 4: Displaying and Describing Categorical Data21 Questions
Exam 5: Displaying and Describing Quantitative Data24 Questions
Exam 6: Correlation and Linear Regression36 Questions
Exam 7: Randomness and Probability28 Questions
Exam 8: Random Variables and Probability Models24 Questions
Exam 9: The Normal Distribution21 Questions
Exam 10: Confidence Intervals for Means20 Questions
Exam 11: Confidence Intervals for Proportions28 Questions
Exam 12: Confidence Intervals for Means21 Questions
Exam 13: Testing Hypotheses18 Questions
Exam 14: Comparing Two Groups19 Questions
Exam 15: Inference for Counts: Chi-Square20 Questions
Exam 16: Inference for Regression22 Questions
Exam 17: Understanding Residuals22 Questions
Exam 18: Multiple Regression15 Questions
Exam 19: Data13 Questions
Exam 22: Business Statistics20 Questions
Exam 24: Decision Making and Risk25 Questions
Exam 25: Introduction to Data Mining11 Questions
Exam 26: Exploring and Collecting Data43 Questions
Exam 27: Modeling With Probability20 Questions
Exam 28: Inference for Decision Making25 Questions
Exam 29: Models for Decision Making38 Questions
Exam 30: Selected Topics in Decision Making22 Questions
Select questions type
Three brands of AAA batteries are compared to determine if differences in
Lifetime exist. Each brand is tested in four devices (TV remote, hand-held game,
Flashlight and digital camera). The experiment is run once for each combination of brand
And device. The twelve runs are ordered randomly. The time (in minutes) that each
Battery lasts under continuous usage is recorded. Which of the following statements is
True about this design?
Free
(Multiple Choice)
4.8/5  (39)
(39)
Correct Answer: Verified
B
A major customer for a vendor of plastic containers requires that its containers
Have a volume of 10,000 cubic inches with a tolerance of 50 cubic inches. To ensure that
Its process is under control and meeting its major customer's specifications, the vendor
Uses control charting. Forty subgroups of five containers each were selected periodically
From the production process. The average of the means across all subgroups was found
To be 10,012 cubic inches and the average range was 48 cubic inches. What is the Cp
Index?
Free
(Multiple Choice)
4.7/5 (32)
Correct Answer:Verified
B
The nonparametric alternative to the two sample t-test is the
Free
(Multiple Choice)
4.8/5 (32)
Correct Answer:Verified
C
Suppose that six different e-readers were evaluated by two senior citizen
Consumer groups with respect to their suitability for use among the older segment of the
Population. The rankings from 1 (best) to 6 (worst) are shown below. What
Nonparametric method should be used to determine the association between these
Rankings? Model Group 1 Group 2 Kindle 3 1 1 Sony Reader 2 3 Kindle DX 3 2 Alex 4 6 Kobo eReader 5 4 COOL-ER 6 5
(Multiple Choice)
4.8/5 (29)
Three brands of AAA batteries are compared to determine if differences in
Lifetime exist. Each brand is tested in four devices (TV remote, hand-held game,
Flashlight and digital camera). The experiment is run once for each combination of brand
And device. The twelve runs are ordered randomly. The time (in minutes) that each
Battery lasts under continuous usage is recorded. Suppose the P-value associated with the
F-statistic for testing whether brand affects battery lifetime is 0.128. Based on this we
Can conclude that
(Multiple Choice)
4.8/5 (26)
In an effort to reduce the number of data entry errors on its order forms, a
Company would like to initiate control charting. They begin by counting and recording
The number of data entry errors made on the first order form completed each day for a
Month. An appropriate control chart to use for these data is the
(Multiple Choice)
4.9/5 (39)
ASQ (American Society for Quality) routinely conducts a "salary survey" of
Quality professionals. Suppose it is interested in determining if the industries within
Which quality professionals work affect their salaries. They have salary data from
Random samples taken in three different industries: (1 = Consumer Goods, 2 = Financial,
3 = Health Care). Based on the partial ANOVA results shown below, the F statistic value
Is
One-way ANOVA: Salary versus Industry Source DF SS MS F P Industry 2 23343 11671 Error 27 16589 614 Total 29 39932
(Multiple Choice)
4.9/5 (46)
Suppose that six different e-readers were evaluated by two senior citizen groups
With respect to their suitability for use among the older segment of the population. The
Rankings from 1 (best) to 6 (worst) are shown below. Using the appropriate
Nonparametric method, the value of the calculated test statistic to determine if there is a
Difference in the rankings between the two magazines is Model Group 1 Group 2 Kindle 3 1 1 Sony Reader 2 3 Kindle DX 3 2 Alex 4 6 Kobo eReader 5 4 COOL-ER 6 5
(Multiple Choice)
4.9/5 (34)
Three wines (California, Australian and Italian) were tasted by judges as part of
An annual food and wine festival. The judges graded the wines on overall quality (A =
Excellent to F = poor). Each wine was graded by a different group of judges (the data are
Shown below). Are there differences in the perceived quality among the three wines?
The calculated value of the statistic for the appropriate nonparametric test is California Australian Italian A- B- - - A- + - C + B -
(Multiple Choice)
4.8/5 (32)
Three wines (California, Australian and Italian) were tasted by judges as part of
An annual food and wine festival. The judges graded the wines on overall quality (A =
Excellent to F = poor). Each wine was graded by a different group of judges (the data are
Shown below). Are there differences in the perceived quality among the three wines?
The appropriate nonparametric procedure to use is the California Australian Italian + + + - - - - + - - + - -
(Multiple Choice)
4.9/5 (36)
Sunny Side Condominiums recently purchased land outside of Phoenix and is
Trying to decide the size complex it should build (large or small). The following payoff
Table (in thousands of dollars) considers three possible levels of demand. If there is a
45% chance that the demand level will be low, 30% that it will be medium and 25%
Chance that it will be high, what is the expected value of perfect information? 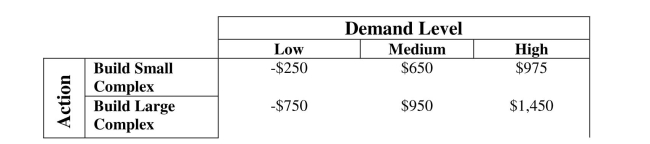
(Multiple Choice)
4.9/5 (25)
Suppose that six different e-readers were evaluated by two senior citizen groups
With respect to their suitability for use among the older segment of the population. The
Rankings from 1 (best) to 6 (worst) are shown below. To determine if there is a difference
In the rankings between the two magazines, the appropriate nonparametric method is the Model Group 1 Group 2 Kindle 3 1 1 Sony Reader 2 3 Kindle DX 3 2 Alex 4 6 Kobo eReader 5 4 COOL-ER 6 5
(Multiple Choice)
4.8/5 (26)
Consider a process that manufactures copper wire. To initiate control charting,
Twenty-five samples of size five are periodically taken and the resistance (in ohms) of
Each wire is measured. An appropriate control chart to use for these data is the
(Multiple Choice)
4.9/5 (34)
A major customer for a vendor of plastic containers requires that its containers
Have a volume of 10,000 cubic inches with a tolerance of 50 cubic inches. To ensure that
Its process is under control and meeting its major customer's specifications, the vendor
Uses control charting. Forty subgroups of five containers each were selected periodically
From the production process. The average of the means across all subgroups was found
To be 10,012 cubic inches and the average range was 48 cubic inches. The lower and
Upper control limits for the X-bar chart are
(Multiple Choice)
4.8/5 (39)
Three brands of AAA batteries are compared to determine if differences in
Lifetime exist. Each brand is tested in four devices (TV remote, hand-held game,
Flashlight and digital camera). The experiment is run once for each combination of brand
And device. The twelve runs are ordered randomly. The time (in minutes) that each
Battery lasts under continuous usage is recorded. Based on the partial ANOVA results
Shown below, the F-statistic for testing whether the three brands of AAA batteries have
Equal mean lifetimes is
Two-way ANOVA: Time (min) versus Brand, Device Source DF SS MS F P Brand 2 2974 1487 Device 3 2496533 832178 Error 6 3017 503 Total 11 2502524
(Multiple Choice)
4.9/5 (41)
Sunny Side Condominiums recently purchased land outside of Phoenix and is
Trying to decide the size complex it should build (large or small). The following payoff
Table (in thousands of dollars) considers three possible levels of demand. Using the
Maximax approach, Sunny Side should 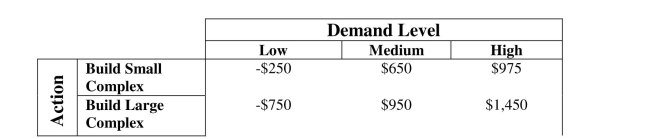
(Multiple Choice)
4.9/5 (34)
A major customer for a vendor of plastic containers requires that its containers
Have a volume of 10,000 cubic inches with a tolerance of 50 cubic inches. To ensure that
Its process is under control and meeting its major customer's specifications, the vendor
Uses control charting. Forty subgroups of five containers each were selected periodically
From the production process. The average of the means across all subgroups was found
To be 10,012 cubic inches and the average range was 48 cubic inches. The lower and
Upper control limits for the R chart are
(Multiple Choice)
4.8/5 (39)
Sunny Side Condominiums recently purchased land outside of Phoenix and is
Trying to decide the size complex it should build (large or small). The following payoff
Table (in thousands of dollars) considers three possible levels of demand. If there is a
45% chance that the demand level will be low, 30% that it will be medium and 25%
Chance that it will be high, the expected value (in thousands of dollars) associated with
The best action is 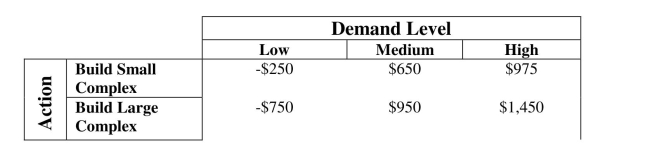
(Multiple Choice)
4.8/5 (32)
Disparate databases that include demographic and transactional variables merged
Together are referred to as
(Multiple Choice)
4.7/5 (31)
A major customer for a vendor of plastic containers requires that its containers
Have a volume of 10,000 cubic inches with a tolerance of 50 cubic inches. To ensure that
Its process is under control and meeting its major customer's specifications, the vendor
Uses control charting. Forty subgroups of five containers each were selected periodically
From the production process. The average of the means across all subgroups was found
To be 10,012 cubic inches and the average range was 48 cubic inches. The estimated
Process standard deviation (
) is
(Multiple Choice)
4.7/5 (33)
Filters
- Essay(0)
- Multiple Choice(0)
- Short Answer(0)
- True False(0)
- Matching(0)