Exam 4: Displaying and Describing Categorical Data
Exam 2: Data20 Questions
Exam 3: Surveys and Sampling26 Questions
Exam 4: Displaying and Describing Categorical Data21 Questions
Exam 5: Displaying and Describing Quantitative Data24 Questions
Exam 6: Correlation and Linear Regression36 Questions
Exam 7: Randomness and Probability28 Questions
Exam 8: Random Variables and Probability Models24 Questions
Exam 9: The Normal Distribution21 Questions
Exam 10: Confidence Intervals for Means20 Questions
Exam 11: Confidence Intervals for Proportions28 Questions
Exam 12: Confidence Intervals for Means21 Questions
Exam 13: Testing Hypotheses18 Questions
Exam 14: Comparing Two Groups19 Questions
Exam 15: Inference for Counts: Chi-Square20 Questions
Exam 16: Inference for Regression22 Questions
Exam 17: Understanding Residuals22 Questions
Exam 18: Multiple Regression15 Questions
Exam 19: Data13 Questions
Exam 22: Business Statistics20 Questions
Exam 24: Decision Making and Risk25 Questions
Exam 25: Introduction to Data Mining11 Questions
Exam 26: Exploring and Collecting Data43 Questions
Exam 27: Modeling With Probability20 Questions
Exam 28: Inference for Decision Making25 Questions
Exam 29: Models for Decision Making38 Questions
Exam 30: Selected Topics in Decision Making22 Questions
Select questions type
Determine if a display of data is appropriate.
-The pie chart below for data collected about clients of brokerage firm shows 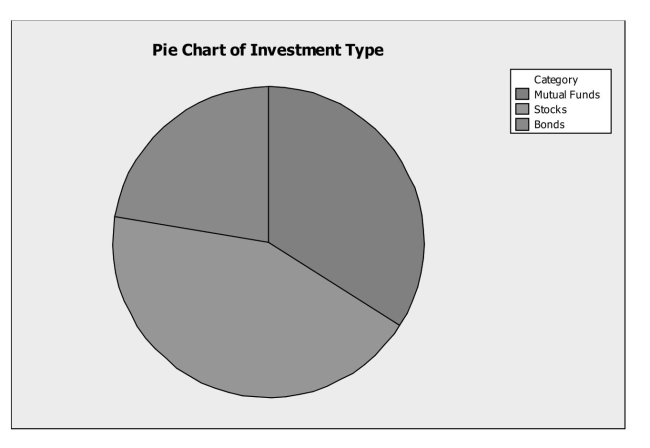
Free
(Multiple Choice)
4.9/5  (30)
(30)
Correct Answer: Verified
D
Interpret summary statistics.
-Identify the variables and tell whether each is categorical or quantitative.
Free
(Essay)
4.8/5 (26)
Correct Answer:Verified
Mode of investment and age; mode of investment is categorical; age is a quantitative
variable. However, in this case investors are grouped according to age therefore the "age
category" is relevant and this is categorical.
Determine if a display of data is appropriate.
-A regional survey was carried out to gauge public opinion on the controversial
Arizona Immigration Law. The results are displayed in the segmented bar chart below.
Which of the following statements is true? 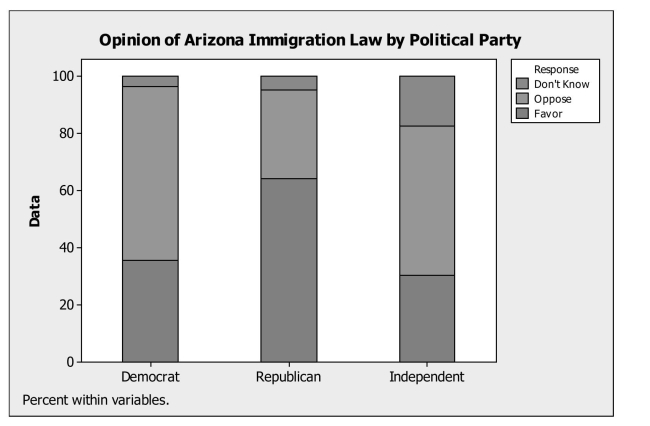
Free
(Multiple Choice)
4.7/5 (29)
Correct Answer:Verified
D
Determine if a display of data is appropriate.
-Based on the side-by-side bar chart summarizing consumer preferences for various
Brands of digital cameras by gender, which of the following statements is (are) true? 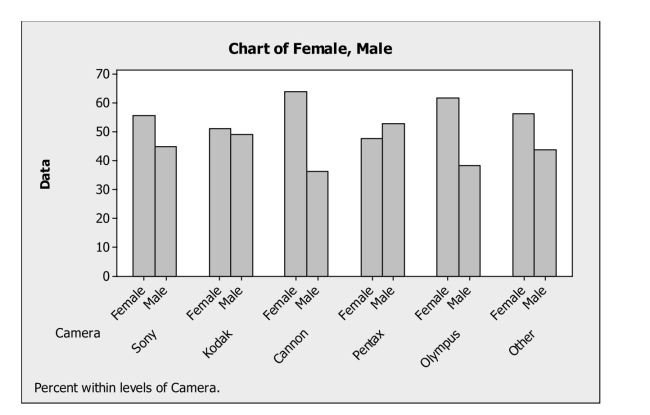
(Multiple Choice)
4.8/5 (34)
Find conditional and marginal distributions.
-A regional survey was carried out to gauge public opinion on the controversial
Arizona Immigration Law. Based on the results displayed in the table below, what
Percent of respondents is Independent? Response Democrat Republican Independent Favor 50 93 35 Oppose 85 45 60 Don't Know 5 7 20
(Multiple Choice)
4.8/5 (32)
Find conditional and marginal distributions.
-A full service brokerage firm gathered information on how their clients were investing
For retirement. Based on age, clients were categorized according to where the largest
Percentage of their retirement portfolio was invested and shown in the table below. Of
The clients who invest in mutual funds, the percentage over age 50 is Age 50 or Younger Over Age 50 Total Mutual Funds 30 34 Stocks 37 45 Bonds 19 23 Total
(Multiple Choice)
4.7/5 (43)
Find conditional and marginal distributions.
-A large national retailer of electronics conducted a survey to determine consumer
Preferences for various brands of digital cameras and the data are summarized in the table
Shown below. Of the consumers who prefer Pentax, what percentage is male? Female Male Total Sony Cyber-Shot 73 59 Kodak - Easy Share 49 47 Cannon Power Shot 58 33 Pentax 37 41 Olympus 45 28 Other Brands 86 67 Total
(Multiple Choice)
4.9/5 (30)
Interpret summary statistics.
-Find each of the following percentages.
a. What percent of the clients are over age 50 who invests in mutual funds?
b. What percent of clients over age 50 invest in mutual funds?
c. What percent of the mutual fund investors are over age 50?
(Essay)
4.9/5 (34)
Find conditional and marginal distributions.
-A full service brokerage firm gathered information on how their clients were investing
For retirement. Based on age, clients were categorized according to where the largest
Percentage of their retirement portfolio was invested and shown in the table below. Of
The clients over age 50, the percentage who invest in mutual funds is Age 50 or Younger Over Age 50 Total Mutual Funds 30 34 Stocks 37 45 Bonds 19 23 Total
(Multiple Choice)
4.8/5 (35)
Examine a contingency table.
-A full service brokerage firm gathered information on how their clients were investing
For retirement. Based on age, clients were categorized according to where the largest
Percentage of their retirement portfolio was invested and shown in the table below. The
Percentage of clients who are over age 50 and invest in mutual funds is Age 50 or Younger Over Age 50 Total Mutual Funds 30 34 Stocks 37 45 Bonds 19 23 Total
(Multiple Choice)
4.8/5 (38)
Examine a contingency table.
-A regional survey was carried out to gauge public opinion on the controversial
Arizona Immigration Law (results shown below). How many respondents are
Republican and favor the law? Response Democrat Republican Independent Favor 50 93 35 Oppose 85 45 60 Don't Know 5 7 20
(Multiple Choice)
4.9/5 (36)
Create and analyze relative frequency distributions.
-A restaurant uses comment cards to get feedback from its customers about newly
Added items to the menu. It recently introduced homemade organic veggie burgers.
Customers who tried the new burger were asked if they would order it again. The data
Are summarized in the table below. What percentage of customers would most likely or
Definitely order the veggie burger again? Response Frequency Definitely would. 10 Most likely would. 40 Maybe 12 Definitely would not. 3
(Multiple Choice)
4.8/5 (42)
Find conditional and marginal distributions.
-A regional survey was carried out to gauge public opinion on the controversial
Arizona Immigration Law (results shown below). Of respondents who oppose the law,
What percent is Democrat? Response Democrat Republican Independent Favor 50 93 35 Oppose 85 45 60 Don't Know 5 7 20
(Multiple Choice)
4.9/5 (39)
Determine if a display of data is appropriate.
-In May, 2010, the Pew Research Center for the People & the Press carried out a
National survey to gauge opinion on the Arizona Immigration Law. Responses (Favor,
Oppose, Don't Know) were examined according to groups defined by political party
Affiliation (Democrat, Republican, Independent). Which of the following would be
Appropriate for displaying these data?
(Multiple Choice)
4.8/5 (31)
Examine a contingency table.
-A large national retailer of electronics conducted a survey to determine consumer
Preferences for various brands of digital cameras and the data are summarized in the table
Shown below. The percentage of consumers who are male and prefer Pentax is Female Male Total Sony Cyber-Shot 73 59 Kodak - Easy Share 49 47 Cannon Power Shot 58 33 Pentax 37 41 Olympus 45 28 Other Brands 86 67 Total
(Multiple Choice)
4.9/5 (40)
Find conditional and marginal distributions.
-A full service brokerage firm gathered information on how their clients were investing
For retirement. Based on age, clients were categorized according to where the largest
Percentage of their retirement portfolio was invested and shown in the table below. The
Percentage of clients over age 50 is Age 50 or Younger Over Age 50 Total Mutual Funds 30 34 Stocks 37 45 Bonds 19 23 Total
(Multiple Choice)
4.8/5 (31)
Create and analyze relative frequency distributions.
-A restaurant uses comment cards to get feedback from its customers about newly
Added items to the menu. It recently introduced homemade organic veggie burgers.
Customers who tried the new burger were asked if they would order it again. The data
Are summarized in the table below. What percentage of customers would definitely order
The veggie burger again? Response Frequency Definitely would. 10 Most likely would. 40 Maybe 12 Definitely would not. 3
(Multiple Choice)
4.8/5 (35)
Find conditional and marginal distributions.
-A large national retailer of electronics conducted a survey to determine consumer
Preferences for various brands of digital cameras and the data are summarized in the table
Shown below. Of the consumers who are male, the percentage who prefer Pentax is
Female Male Total
Sony Cyber-Shot 73 59 132
Kodak - Easy Share 49 47 96
Cannon Power Shot 58 33 91
Pentax 37 41 78
Olympus 45 28 73
Other Brands 86 67 153
Total 348 275 623
(Multiple Choice)
4.8/5 (39)
Find conditional and marginal distributions.
-A regional survey was carried out to gauge public opinion on the controversial
Arizona Immigration Law (results shown below). What percent oppose the law? Response Democrat Republican Independent Favor 50 93 35 Oppose 85 45 60 Don't Know 5 7 20
(Multiple Choice)
4.9/5 (30)
Determine if a display of data is appropriate.
-The following bar chart summarizing consumer preferences for various brands of
Digital cameras shows 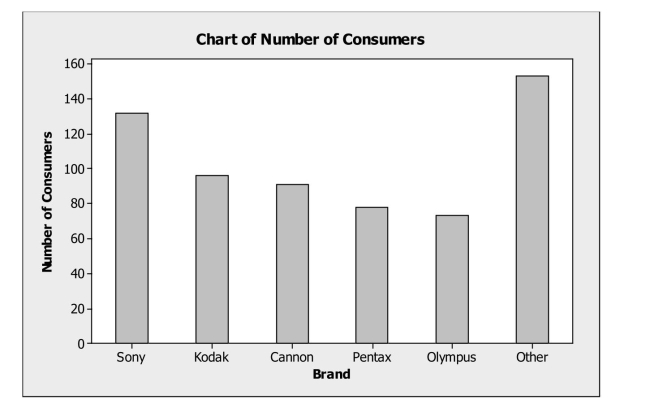
(Multiple Choice)
4.8/5 (39)
Filters
- Essay(0)
- Multiple Choice(0)
- Short Answer(0)
- True False(0)
- Matching(0)