Exam 18: Multiple Regression
Exam 2: Data20 Questions
Exam 3: Surveys and Sampling26 Questions
Exam 4: Displaying and Describing Categorical Data21 Questions
Exam 5: Displaying and Describing Quantitative Data24 Questions
Exam 6: Correlation and Linear Regression36 Questions
Exam 7: Randomness and Probability28 Questions
Exam 8: Random Variables and Probability Models24 Questions
Exam 9: The Normal Distribution21 Questions
Exam 10: Confidence Intervals for Means20 Questions
Exam 11: Confidence Intervals for Proportions28 Questions
Exam 12: Confidence Intervals for Means21 Questions
Exam 13: Testing Hypotheses18 Questions
Exam 14: Comparing Two Groups19 Questions
Exam 15: Inference for Counts: Chi-Square20 Questions
Exam 16: Inference for Regression22 Questions
Exam 17: Understanding Residuals22 Questions
Exam 18: Multiple Regression15 Questions
Exam 19: Data13 Questions
Exam 22: Business Statistics20 Questions
Exam 24: Decision Making and Risk25 Questions
Exam 25: Introduction to Data Mining11 Questions
Exam 26: Exploring and Collecting Data43 Questions
Exam 27: Modeling With Probability20 Questions
Exam 28: Inference for Decision Making25 Questions
Exam 29: Models for Decision Making38 Questions
Exam 30: Selected Topics in Decision Making22 Questions
Select questions type
Perform statistical inference for multiple regression.
-What affects flat panel LCD TV sales? Flat panel LCD TV's are sold through a
Variety of outlets. Sales figures (number of units) for the popular Sony Bravia were
Obtained for last quarter from a sample of 30 different stores. Also collected were data
On the selling price and amount spent on advertising the Sony Bravia (as a percentage of
Total advertising expenditure in the previous quarter) at each store. Output is shown
Below. The calculated t-statistic to determine if amount spent on advertising is a
Significant independent variable in explaining Sony Bravia sales is
Predictor Coef SE Coef T P Constant 90.19 25.08 3.60 0.001 Price -0.03055 0.01005 -3.04 0.005 Advertising 3.0926 0.3680 8.40 0.000
Free
(Multiple Choice)
4.9/5  (31)
(31)
Correct Answer: Verified
C
Interpret multiple regression output.
-In determining the best companies to work for, a number of variables are considered,
Including size, average annual pay, and turnover rate, etc. Employee surveys are often
Conducted in order to assess aspects of the organization's culture, such as trust and
Openness to change. A sample of 33 companies was randomly selected and data
Collected on the average annual bonus and turnover rate (%). A questionnaire was also
Administered to the employees of each company to arrive at a trust index (measured on a
Scale of 0 - 100). Based on the output shown below, how much of the variability in
Turnover Rate is explained by the estimated multiple regression model?
Predictor Coef SE Coef T P Constant 12.1005 0.7826 15.46 0.000 Trust Index -0.07149 0.01966 -3.64 0.001 Average Bonus -0.0007216 0.0001481 -4.87 0.000
Free
(Multiple Choice)
4.9/5 (43)
Correct Answer:Verified
B
Interpret multiple regression output.
-What affects flat panel LCD TV sales? Flat panel LCD TV's are sold through a
Variety of outlets. Sales figures (number of units) for the popular Sony Bravia were
Obtained for last quarter from a sample of 30 different stores. Also collected were data
On the selling price and amount spent on advertising the Sony Bravia (as a percentage of
Total advertising expenditure in the previous quarter) at each store. Output is shown
Below. Using the estimated multiple regression model, the number of units sold on
Average at a store that sells the Sony Bravia for $2199 and spends 10% of its advertising
Budget on the product is
Predictor Coef SE Coef T P Constant 90.19 25.08 3.60 0.001 Price -0.03055 0.01005 -3.04 0.005 Advertising 3.0926 0.3680 8.40 0.000
Free
(Multiple Choice)
4.8/5 (36)
Correct Answer:Verified
A
Write out the multiple regression model.
-In determining the best companies to work for, a number of variables are considered,
Including size, average annual pay, and turnover rate, etc. Employee surveys are often
Conducted in order to assess aspects of the organization's culture, such as trust and
Openness to change. A sample of 33 companies was randomly selected and data
Collected on the average annual bonus and turnover rate (%). A questionnaire was also
Administered to the employees of each company to arrive at a trust index (measured on a
Scale of 0 - 100). Based on the output shown below, the estimated multiple regression
Model is
Predictor Coef SE Coef T P Constant 12.1005 0.7826 15.46 0.000 Trust Index -0.07149 0.01966 -3.64 0.001 Average Bonus -0.0007216 0.0001481 -4.87 0.000
(Multiple Choice)
4.9/5 (39)
Interpret multiple regression coefficients.
-What affects flat panel LCD TV sales? Flat panel LCD TV's are sold through a
Variety of outlets. Sales figures (number of units) for the popular Sony Bravia were
Obtained for last quarter from a sample of 30 different stores. Also collected were data
On the selling price and amount spent on advertising the Sony Bravia (as a percentage of
Total advertising expenditure in the previous quarter) at each store. Based on the results
Shown below, the correct interpretation of the regression coefficient for Advertising is Dependent Variable is Sales Predictor Coef SE Coef T P Constant 90.19 25.08 3.60 0.001 Price -0.03055 0.01005 -3.04 0.005 Advertising 3.0926 0.3680 8.40 0.000
(Multiple Choice)
4.9/5 (36)
Perform statistical inference for multiple regression.
-What affects flat panel LCD TV sales? Flat panel LCD TV's are sold through a
Variety of outlets. Sales figures (number of units) for the popular Sony Bravia were
Obtained for last quarter from a sample of 30 different stores. Also collected were data
On the selling price and amount spent on advertising the Sony Bravia (as a percentage of
Total advertising expenditure in the previous quarter) at each store. Output is shown
Below. The correct null and alternative hypotheses for testing the regression coefficient
Of Price is Dependent variable is Sales Predictor Coef SE Coef T P Constant 90.19 25.08 3.60 0.001 Price -0.03055 0.01005 -3.04 0.005 Advertising 3.0926 0.3680 8.40 0.000
A. vs.
B. vs.
C. vs.
D. vs.
E. : The regression is not significant vs. : The regression is significant.
(Short Answer)
4.8/5 (22)
Perform statistical inference for multiple regression.
-In determining the best companies to work for, a number of variables are considered,
Including size, average annual pay, and turnover rate, etc. Employee surveys are often
Conducted in order to assess aspects of the organization's culture, such as trust and
Openness to change. A sample of 33 companies was randomly selected and data
Collected on the average annual bonus and turnover rate (%). A questionnaire was also
Administered to the employees of each company to arrive at a trust index (measured on a
Scale of 0 - 100). Based on the output shown below, the correct interpretation of the
Regression coefficient associated with Average Bonus is Dependent Variable is Turnover Rate
Predictor Coef SE Coef T P Constant 12.1005 0.7826 15.46 0.000 Trust Index -0.07149 0.01966 -3.64 0.001 Average Bonus -0.0007216 0.0001481 -4.87 0.000
(Multiple Choice)
4.8/5 (41)
Perform statistical inference for multiple regression.
-What affects flat panel LCD TV sales? Flat panel LCD TV's are sold through a
Variety of outlets. Sales figures (number of units) for the popular Sony Bravia were
Obtained for last quarter from a sample of 30 different stores. Also collected were data
On the selling price and amount spent on advertising the Sony Bravia (as a percentage of
Total advertising expenditure in the previous quarter) at each store. Output is shown
Below. Which of the following statements is / are true? Dependent Variable is Sales
Predictor Coef SE Coef T P Constant 90.19 25.08 3.60 0.001 Price -0.03055 0.01005 -3.04 0.005 Advertising 3.0926 0.3680 8.40 0.000
Analysis of Variance
Source DF SS MS Regression 2 16477.3 8238.7 Residual Error 27 3038.0 112.5 Total 29 19515.4
(Multiple Choice)
4.9/5 (28)
Perform statistical inference for multiple regression.
-What affects flat panel LCD TV sales? Flat panel LCD TV's are sold through a
Variety of outlets. Sales figures (number of units) for the popular Sony Bravia were
Obtained for last quarter from a sample of 30 different stores. Also collected were data
On the selling price and amount spent on advertising the Sony Bravia (as a percentage of
Total advertising expenditure in the previous quarter) at each store. Output is shown
Below. The calculated F statistic to determine the overall significance of the estimated
Multiple regression model is Analysis of Variance Source DF SS MS Regression 2 16477.3 8238.7 Residual Error 27 3038.0 112.5 Total 29 19515.4
(Multiple Choice)
4.9/5 (36)
Interpret multiple regression output.
-What affects flat panel LCD TV sales? Flat panel LCD TV's are sold through a
Variety of outlets. Sales figures (number of units) for the popular Sony Bravia were
Obtained for last quarter from a sample of 30 different stores. Also collected were data
On the selling price and amount spent on advertising the Sony Bravia (as a percentage of
Total advertising expenditure in the previous quarter) at each store. Output is shown
Below. Based on the output shown below, how much of the variability in Sales is
Explained by the estimated multiple regression model? Analysis of Variance Source DF SS MS Regression 2 16477.3 8238.7 Residual Error 27 3038.0 112.5 Total 29 19515.4
(Multiple Choice)
4.8/5 (28)
Interpret multiple regression coefficients.
-In determining the best companies to work for, a number of variables are considered,
Including size, average annual pay, and turnover rate, etc. Employee surveys are often
Conducted in order to assess aspects of the organization's culture, such as trust and
Openness to change. A sample of 33 companies was randomly selected and data
Collected on the average annual bonus and turnover rate (%). A questionnaire was also
Administered to the employees of each company to arrive at a trust index (measured on a
Scale of 0 - 100). Based on the results shown below, the correct interpretation of the
Regression coefficient for the variable Trust Index is Dependent Variable is Turnover Rate Predictor Coef SE Coef Constant 12.1005 0.7826 15.46 0.000 Trust Index -0.07149 0.01966 -3.64 0.001 Average Bonus -0.0007216 0.0001481 -4.87 0.000
(Multiple Choice)
4.8/5 (34)
8.3. Check assumptions and conditions for the multiple regression model.
-What affects flat panel LCD TV sales? Flat panel LCD TV's are sold through a
Variety of outlets. Sales figures (number of units) for the popular Sony Bravia were
Obtained for last quarter from a sample of 30 different stores. Also collected were data
On the selling price and amount spent on advertising the Sony Bravia (as a percentage of
Total advertising expenditure in the previous quarter) at each store. A multiple regression
Model was fit to the data and the plot of residuals versus predicted values is shown
Below. What does the residual plot suggest? 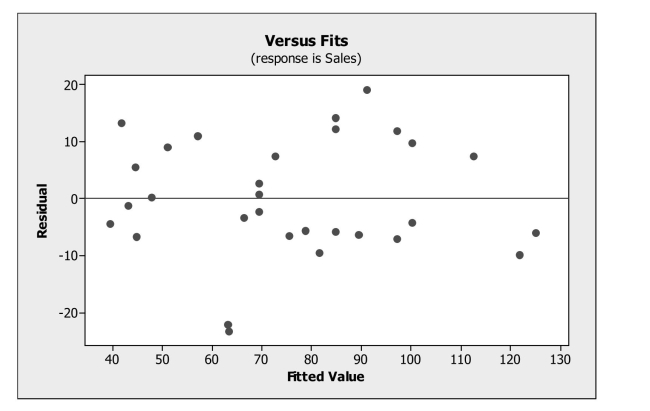
(Multiple Choice)
4.9/5 (31)
Interpret multiple regression output.
-In determining the best companies to work for, a number of variables are considered,
Including size, average annual pay, and turnover rate, etc. Employee surveys are often
Conducted in order to assess aspects of the organization's culture, such as trust and
Openness to change. A sample of 33 companies was randomly selected and data
Collected on the average annual bonus and turnover rate (%). A questionnaire was also
Administered to the employees of each company to arrive at a trust index (measured on a
Scale of 0 - 100). Based on the output shown below, a company having a trust index
Score of 70 and an average annual bonus of $6500 has a predicted turnover rate of
Predictor Coef SE Coef T P Constant 12.1005 0.7826 15.46 0.000 Trust Index -0.07149 0.01966 -3.64 0.001 Average Bonus -0.0007216 0.0001481 -4.87 0.000
(Multiple Choice)
4.8/5 (46)
Interpret multiple regression coefficients.
-What affects flat panel LCD TV sales? Flat panel LCD TV's are sold through a
Variety of outlets. Sales figures (number of units) for the popular Sony Bravia were
Obtained for last quarter from a sample of 30 different stores. Also collected were data
On the selling price and amount spent on advertising the Sony Bravia (as a percentage of
Total advertising expenditure in the previous quarter) at each store. Based on the results
Shown below, the correct interpretation of the regression coefficient for Price is Dependent Variable is Sales Predictor Coef SE Coef T P Constant 90.19 25.08 3.60 0.001 Price -0.03055 0.01005 -3.04 0.005 Advertising 3.0926 0.3680 8.40 0.000
(Multiple Choice)
4.7/5 (29)
What affects flat panel LCD TV sales? Flat panel LCD TV's are sold through a
variety of outlets such as large and small electronics stores, department stores, large
discount chains and online. Sales figures (number of units) for the popular Sony Bravia
were obtained for last quarter from a sample of 30 different stores. Also collected were
data on the selling price and amount spent on advertising the Sony Bravia (as a
percentage of total advertising expenditure in the previous quarter) at each store. Below
are the multiple regression results.
Predictor Coef SE Coef T P Constant 90.19 25.08 3.60 0.001 Price -0.03055 0.01005 -3.04 0.005 Advertising 3.0926 0.3680 8.40 0.000
Source DF SS MS Regression 2 16477.3 8238.7 Residual Error 27 3038.0 112.5 Total 29 19515.4
a. Write out the estimated regression equation.
b. Is the regression equation significant overall? Explain.
c. How much of the variability in Sales is explained by the regression equation?
d. State the hypotheses for testing the regression coefficient of Price. Based on the
results, what do you conclude?
e. State the hypotheses for testing the regression coefficient of Advertising Expenditure.
Based on the results, what do you conclude?
f. Predict the sales for a store that sells the Sony Bravia for $2199 and spends 10% of its
advertising budget on the product.
g. Comment on whether the conditions for multiple regression are satisfied based on the
plots shown below.
(Essay)
4.8/5 (27)
Filters
- Essay(0)
- Multiple Choice(0)
- Short Answer(0)
- True False(0)
- Matching(0)