Exam 5: Displaying and Describing Quantitative Data
Exam 2: Data20 Questions
Exam 3: Surveys and Sampling26 Questions
Exam 4: Displaying and Describing Categorical Data21 Questions
Exam 5: Displaying and Describing Quantitative Data24 Questions
Exam 6: Correlation and Linear Regression36 Questions
Exam 7: Randomness and Probability28 Questions
Exam 8: Random Variables and Probability Models24 Questions
Exam 9: The Normal Distribution21 Questions
Exam 10: Confidence Intervals for Means20 Questions
Exam 11: Confidence Intervals for Proportions28 Questions
Exam 12: Confidence Intervals for Means21 Questions
Exam 13: Testing Hypotheses18 Questions
Exam 14: Comparing Two Groups19 Questions
Exam 15: Inference for Counts: Chi-Square20 Questions
Exam 16: Inference for Regression22 Questions
Exam 17: Understanding Residuals22 Questions
Exam 18: Multiple Regression15 Questions
Exam 19: Data13 Questions
Exam 22: Business Statistics20 Questions
Exam 24: Decision Making and Risk25 Questions
Exam 25: Introduction to Data Mining11 Questions
Exam 26: Exploring and Collecting Data43 Questions
Exam 27: Modeling With Probability20 Questions
Exam 28: Inference for Decision Making25 Questions
Exam 29: Models for Decision Making38 Questions
Exam 30: Selected Topics in Decision Making22 Questions
Select questions type
Analyze data of quantitative variables.
-The following table shows total assets ($ billion) for a small sample of U.S. banks.
The mean for these data is BANK ASSETS (\ billion) Bank of New York 88 Regions Financial 80 Fifth Third Bank 58 State Street Bank and Trust 92 Branch Banking and Trust Company 81 Chase Bank 70 Key Bank 89 PNC Bank 84
Free
(Multiple Choice)
4.8/5  (43)
(43)
Correct Answer: Verified
A
Following is the five number summary of the hourly wages ($) for advertising /
promotion managers displayed in question 1. Min Q1 Median Q3 Max 19.64 29.36 34.18 40.86 57.26
a. Would you expect the mean salary for this sample of marketing managers to be higher
or lower than the median? Explain.
b. Which would be a more appropriate measure of central tendency for these data, the
mean or median? Explain.
c. Calculate the range.
d. Calculate the IQR.
Free
(Short Answer)
4.8/5 (36)
Correct Answer:Verified
50
Analyze scatterplots and correlation coefficients.
-Suppose the marketing manager who was earning $129,420 got a raise and is now
earning $140,000. Indicate how this change would affect the following summary
statistics (increase, decrease, or stay about the same):
a. Mean
b. Median
c. Range
d. IQR
e. Standard deviation
Free
(Essay)
5.0/5 (30)
Correct Answer:Verified
Increase.
Stay the same.
Increase.
Stay the same.
Increase.
Compare results using standardization.
-The following table shows total assets ($ billion) for a small sample of U.S. banks.
The z- score for the total assets of Fifth Third Bank is BANK ASSETS (\ billion) Bank of New York 88 Regions Financial 80 Fifth Third Bank 58 State Street Bank and Trust 92 Branch Banking and Trust Company 81 Chase Bank 70 Key Bank 89 PNC Bank 84
(Multiple Choice)
4.8/5 (40)
Compare results using standardization.
-The ASQ (American Society for Quality) regularly conducts a salary survey of its
Membership, primarily quality management professionals. Based on the most recently
Published mean and standard deviation, a quality control specialist calculated the z-score
Associated with his own salary and found it was -2.50. This tells him that his salary is
(Multiple Choice)
4.9/5 (35)
Interpret summary statistics.
-Consider the five number summary of hourly wages ($) for a sample of advertising /
Promotion managers. Suppose there had been an error and that the lowest hourly wage
Was $15.50 instead of $19.64. This would result in Min Q1 Median Q3 Max 19.64 29.36 34.18 40.86 57.26
(Multiple Choice)
4.8/5 (26)
Analyze data of quantitative variables.
-The following table shows closing share prices for a small sample of companies. The
Standard deviation in closing share prices is COMPANY CLOSING SHARE PRICE - 08/07 3M Dental Products 86.95 Tyco Electronics Power Systems 47.45 Kyocera America Inc. 94.10 Pfizer Inc. 22.39 Xerox Company 17.56 Northrop Grumman Corporation 75.81 Lockheed Martin Maritime Systems 100.17 Sony DADC 51.91 Matsushita Electronic Components 17.91 Foster Wheeler Environmental Corp. 55.67
(Multiple Choice)
5.0/5 (35)
Interpret summary statistics.
-Consider the five number summary of hourly wages ($) for a sample of sales
Managers. The IQR for these data is Min Q1 Median Q3 Max 20.94 37.64 44.77 49.34 67.11
(Multiple Choice)
4.9/5 (37)
The following boxplots show monthly sales revenue figures ($ thousands) for a
discount office supply company with locations in three different regions of the U.S.
(Northeast, Southeast, and West).
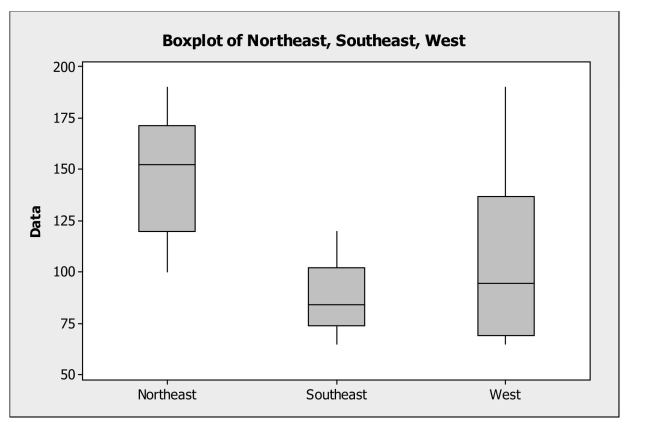 a. Which region has the highest median sales revenue?
b. Which region has the lowest median sales revenue?
c. Which region has the most variable sales revenue values? Explain.
a. Which region has the highest median sales revenue?
b. Which region has the lowest median sales revenue?
c. Which region has the most variable sales revenue values? Explain.
(Essay)
4.9/5 (37)
Describe displays of distributions.
-Below is a histogram of salaries (in $) for a sample of U.S. marketing managers. The
Shape of this distribution is 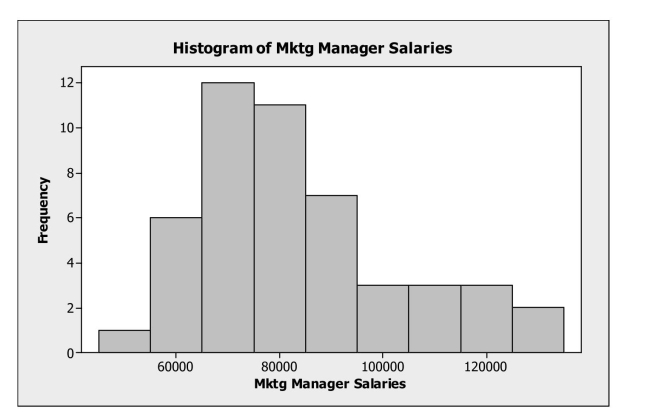
(Multiple Choice)
4.8/5 (38)
Interpret displays of distributions.
-The following boxplots show monthly sales revenue figures ($ thousands) for a
Discount office supply company with locations in three different regions of the U.S.
(Northeast, Southeast, and West). Which of the following statements is false? 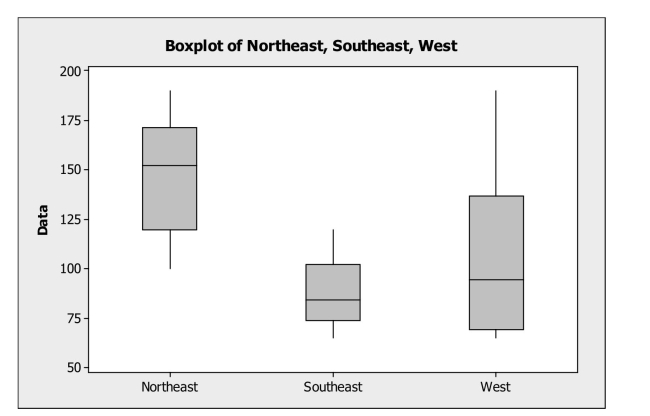
(Multiple Choice)
4.9/5 (36)
Interpret displays of distributions.
-The following boxplots show monthly sales revenue figures ($ thousands) for a
Discount office supply company with locations in three different regions of the U.S.
(Northeast, Southeast, and West). Which of the following statements is true? 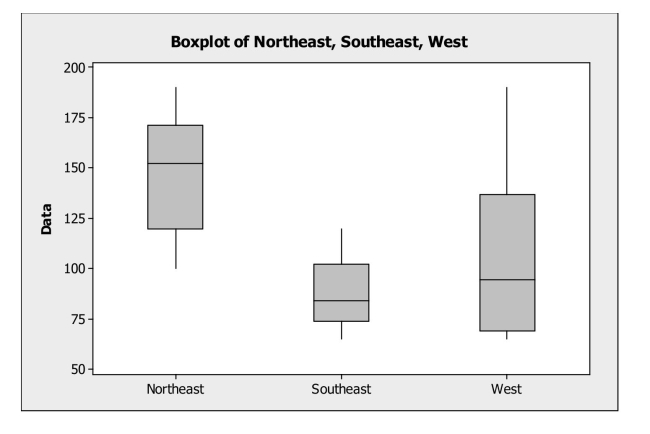
(Multiple Choice)
4.9/5 (27)
Interpret summary statistics.
-Consider the five number summary of hourly wages ($) for a sample of sales
Managers. The range for these data is Min Q1 Median Q3 Max 20.94 37.64 44.77 49.34 67.11
(Multiple Choice)
4.9/5 (46)
The following table shows closing share prices (on the first trading day of August,
2007) for a small sample of companies. COMPANY CLOSING SHARE PRICE - 08/07 3M Dental Products 86.95 Tyco Electronics Power Systems 47.45 Kyocera America Inc. 94.10 Pfizer Inc. 22.39 Xerox Company 17.56 Northrop Grumman Corporation 75.81 Lockheed Martin Maritime Systems 100.17 Sony DADC 51.91 Matsushita Electronic Components 17.91 Foster Wheeler Environmental Corp. 55.67
a. Calculate the mean.
b. Calculate the standard deviation
c. Standardize the share price for Matsushita Electronic Components (find the z score).
Interpret its meaning.
(Essay)
4.8/5 (27)
Following is the five number summary of the hourly wages ($) for sales managers
displayed in question 1. Min Q1 Median Q3 Max 20.94 37.64 44.77 49.34 67.11
Suppose there had been an error and that the lowest hourly wage for sales managers was
$18.50 instead of $20.94. Indicate how this change would affect the following summary
statistics (increase, decrease, or stay about the same):
a. Mean
b. Median
c. Range
d. IQR
e. Standard deviation
(Essay)
4.9/5 (43)
Interpret summary statistics.
-Consider the five number summary of hourly wages ($) for a sample of sales
Managers. Suppose the mean hourly wage is $38.50. What can we say about the shape
Of the distribution? Min Q1 Median Q3 Max 20.94 37.64 44.77 49.34 67.11
(Multiple Choice)
4.8/5 (37)
Analyze scatterplots and correlation coefficients.
-For the data on total assets ($ billion) for a small sample of U.S. banks provided in the
previous question:
a. Calculate the mean.
b. Calculate the standard deviation.
c. Standardize the asset value of Fifth Third Bank (find the z score). Interpret its
meaning.
(Essay)
4.8/5 (29)
Analyze data of quantitative variables.
-The following table shows total assets ($ billion) for a small sample of U.S. banks.
The standard deviation for these data is BANK ASSETS (\ billion) Bank of New York 88 Regions Financial 80 Fifth Third Bank 58 State Street Bank and Trust 92 Branch Banking and Trust Company 81 Chase Bank 70 Key Bank 89 PNC Bank 84
(Multiple Choice)
4.9/5 (46)
Interpret summary statistics.
-Based on the five number summary (shown below) for salaries of U.S. marketing
Managers, the IQR is Min Q1 Median Q3 Max 46360 69693 77020 91750 129420
(Multiple Choice)
4.9/5 (35)
Following is a time series graph for monthly closing price of 3M Dental Products
stock (beginning June 2005). 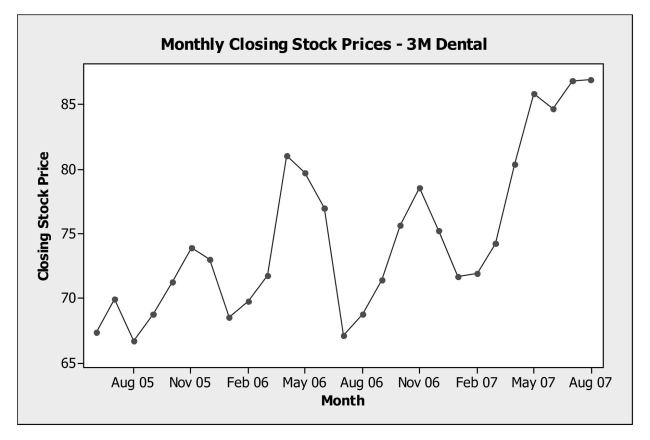 a. Are the closing prices for shares of 3M Dental Products from June 2005 through
August 2007 stationary? Explain.
b. Would a histogram provide a good summary of these stock prices? Explain.
a. Are the closing prices for shares of 3M Dental Products from June 2005 through
August 2007 stationary? Explain.
b. Would a histogram provide a good summary of these stock prices? Explain.
(Essay)
4.8/5 (36)
Filters
- Essay(0)
- Multiple Choice(0)
- Short Answer(0)
- True False(0)
- Matching(0)