Exam 6: Correlation and Linear Regression
Exam 2: Data20 Questions
Exam 3: Surveys and Sampling26 Questions
Exam 4: Displaying and Describing Categorical Data21 Questions
Exam 5: Displaying and Describing Quantitative Data24 Questions
Exam 6: Correlation and Linear Regression36 Questions
Exam 7: Randomness and Probability28 Questions
Exam 8: Random Variables and Probability Models24 Questions
Exam 9: The Normal Distribution21 Questions
Exam 10: Confidence Intervals for Means20 Questions
Exam 11: Confidence Intervals for Proportions28 Questions
Exam 12: Confidence Intervals for Means21 Questions
Exam 13: Testing Hypotheses18 Questions
Exam 14: Comparing Two Groups19 Questions
Exam 15: Inference for Counts: Chi-Square20 Questions
Exam 16: Inference for Regression22 Questions
Exam 17: Understanding Residuals22 Questions
Exam 18: Multiple Regression15 Questions
Exam 19: Data13 Questions
Exam 22: Business Statistics20 Questions
Exam 24: Decision Making and Risk25 Questions
Exam 25: Introduction to Data Mining11 Questions
Exam 26: Exploring and Collecting Data43 Questions
Exam 27: Modeling With Probability20 Questions
Exam 28: Inference for Decision Making25 Questions
Exam 29: Models for Decision Making38 Questions
Exam 30: Selected Topics in Decision Making22 Questions
Select questions type
Understand the relationship between the correlation and the regression line.
-Suppose the correlation, r, between two variables x and y is -0.44. What would you
Predict about a y value if the x value is 2 standard deviations above its mean?
Free
(Multiple Choice)
4.9/5  (26)
(26)
Correct Answer: Verified
A
Shown below is a correlation table showing correlation coefficients between stock
price, earnings per share (EPS), and price / earnings (P / E) ratio for a sample of 19 publicly
traded companies.
Correlations: Stock Price, EPS, PE Stock Price EPS 0.875 0.323 -0.111
a. What is the correlation between stock price and EPS? Interpret.
b. What is the correlation between stock price and PE? Interpret.
c. What is the correlation between EPS and PE? Interpret.
Free
(Essay)
4.9/5 (32)
Correct Answer:Verified
.875, positive and strong.
.323, positive and weak.
-.111, negative and very weak.
Understand the relationship between the correlation and the regression line.
-A company studying the productivity of their employees on a new information system
Was interested in determining if the age (X) of data entry operators influenced the number
Of completed entries made per hour (Y). The regression equation is yˆ = 14.374 − 0.145x .
If sx=14.04 and sy=2.61, then the correlation coefficient between age and productivity is
Free
(Multiple Choice)
4.8/5 (45)
Correct Answer:Verified
E
Use the following to answer questions 5 - 8.
To determine whether the cash bonus paid by a company is related to annual pay, data
were gathered for 10 account executives at Johnson Financial Group who received cash
bonuses in 2007. The data, scatterplot, and summary statistics are shown below. ANNUAL PAY CASH BONUS \ 70609 \ 11225 \ 58487 \ 6238 \ 104561 \ 14194 \ 43922 \ 4188 \ 82613 \ 11863 \ 116250 \ 13671 \ 76751 \ 7758 \ 68513 \ 20760 \ 137000 \ 55000 \ 94469 \ 34368 Mean \ 85318 \ 17927 Standard Deviation \ 28077 \ 15618 Correlation 0.735
-
(Essay)
4.8/5 (34)
Use the following to answer questions 5 - 8.
To determine whether the cash bonus paid by a company is related to annual pay, data
were gathered for 10 account executives at Johnson Financial Group who received cash
bonuses in 2007. The data, scatterplot, and summary statistics are shown below. ANNUAL PAY CASH BONUS \ 70609 \ 11225 \ 58487 \ 6238 \ 104561 \ 14194 \ 43922 \ 4188 \ 82613 \ 11863 \ 116250 \ 13671 \ 76751 \ 7758 \ 68513 \ 20760 \ 137000 \ 55000 \ 94469 \ 34368 Mean \ 85318 \ 17927 Standard Deviation \ 28077 \ 15618 Correlation 0.735
-Estimate the linear regression model that relates the response variable (cash bonus) to
the predictor variable (annual pay).
a. Find the slope of the regression line.
b. Find the intercept of the regression line.
c. Write the equation of the linear model.
(Essay)
4.8/5 (31)
Analyze residuals.
-Based on the following residual plot, which condition / assumption for linear
Regression is not satisfied? 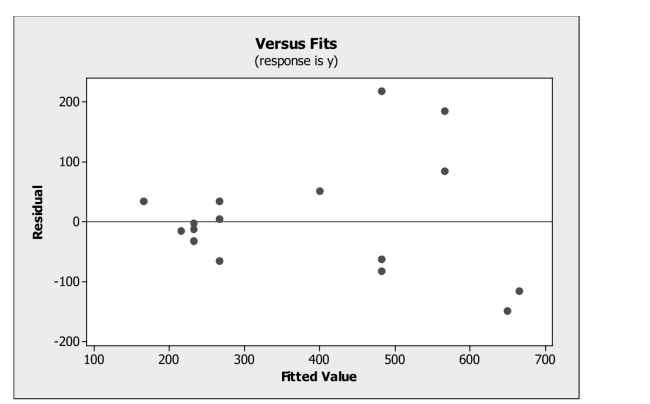
(Multiple Choice)
4.7/5 (35)
Interpret a linear regression equation and use it to make a prediction.
-A company studying the productivity of its employees on a new information system
Was interested in determining if the age (X) of data entry operators influenced the number
Of completed entries made per hour (Y). The regression equation is yˆ = 14.374 − 0.145x .
Suppose the actual completed entries per hour for an operator who is 35 years old was 8.
The residual is
(Multiple Choice)
4.9/5 (34)
Analyze scatterplots and correlation coefficients.
-The scatterplot shows monthly sales figures (in units) and number of months of
Experience for a sample of salespeople. The association between monthly sales and level
Of experience can be described as 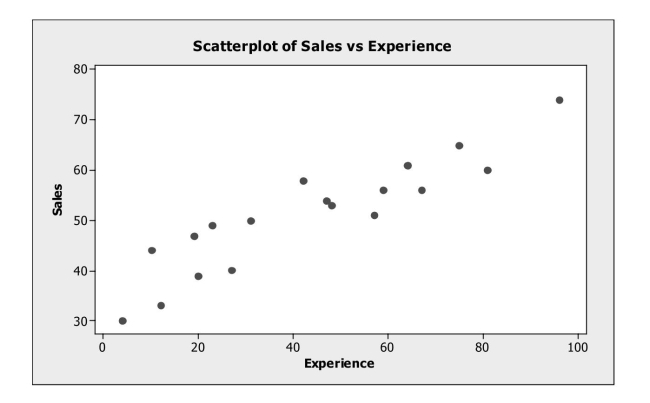
(Multiple Choice)
4.8/5 (35)
In commenting on the increase in home foreclosures, a news reporter stated "there
appears to be a strong correlation between home foreclosures and job loss of the head of
household." Comment on this statement.
(Essay)
4.8/5 (32)
Use the following to answer questions 5 - 8.
To determine whether the cash bonus paid by a company is related to annual pay, data
were gathered for 10 account executives at Johnson Financial Group who received cash
bonuses in 2007. The data, scatterplot, and summary statistics are shown below. ANNUAL PAY CASH BONUS \ 70609 \ 11225 \ 58487 \ 6238 \ 104561 \ 14194 \ 43922 \ 4188 \ 82613 \ 11863 \ 116250 \ 13671 \ 76751 \ 7758 \ 68513 \ 20760 \ 137000 \ 55000 \ 94469 \ 34368 Mean \ 85318 \ 17927 Standard Deviation \ 28077 \ 15618 Correlation 0.735
-Using the estimated regression equation,
a. Estimate the cash bonus for an executive at Johnson Financial earning $82, 613 a year. b. What is the residual for this estimate?
What does it mean?
(Essay)
4.8/5 (23)
Analyze scatterplots and correlation coefficients.
-A consumer research group examining the relationship between the price of meat (per
Pound) and fat content (in grams) gathered data that produced the following scatterplot.
If the point in the lower left hand corner (2 grams of fat; $3.00 per pound) is removed, the
Correlation would most likely 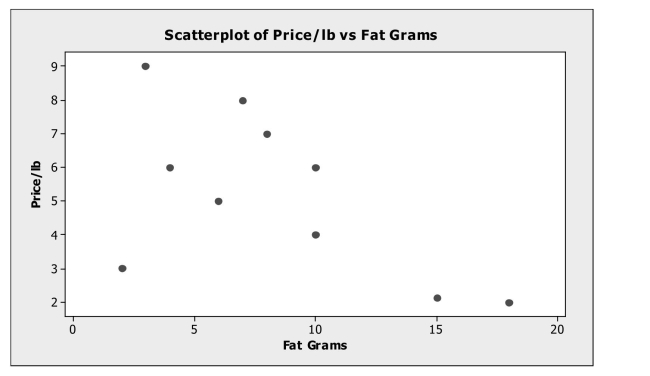
(Multiple Choice)
4.8/5 (37)
Analyze scatterplots and correlation coefficients.
-The scatterplot shows monthly sales figures (in units) and number of months of
Experience for a sample of salespeople. The correlation between monthly sales and level
Of experience is most likely 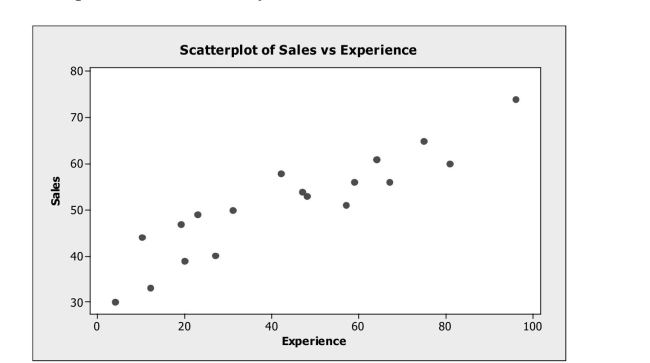
(Multiple Choice)
4.7/5 (37)
In discussing how its customers use online services, a bank manager noted "there
seems to be a strong correlation between the use of the online bill paying feature and
gender." Comment on this statement.
(Essay)
4.8/5 (37)
Check conditions for correlation and linear regression.
-A small independent organic food store offers a variety of specialty coffees. To
Determine whether price has an impact on sales, the managers kept track of how many
Pounds of each variety of coffee were sold last month. Based on the scatterplot shown
Below, which of the following statements is true? 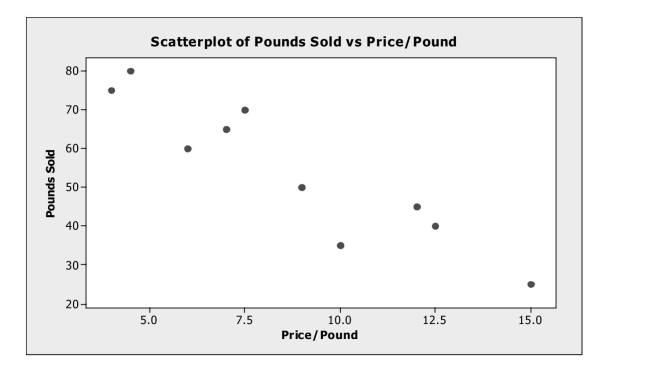
(Multiple Choice)
4.7/5 (19)
Interpret the value of correlation coefficients and squared correlations.
-A small independent organic food store offers a variety of specialty coffees. To
Determine whether price has an impact on sales, the managers kept track of how many
Pounds of each variety of coffee were sold last month. Based on the summary statistics
Shown below, what percent of the variability in the number of pounds of coffee sold per
Week can be explained by price? Mean \ 8.75 54.50 Standard Deviation \ 3.63 18.33 Correlation
(Multiple Choice)
4.9/5 (31)
Assign roles to variables.
-A study examined consumption levels of oil and carbon dioxide emissions for
Sample of counties. The response variable in this study is
(Multiple Choice)
4.9/5 (38)
Use the following to answer questions 5 - 8.
To determine whether the cash bonus paid by a company is related to annual pay, data
were gathered for 10 account executives at Johnson Financial Group who received cash
bonuses in 2007. The data, scatterplot, and summary statistics are shown below. ANNUAL PAY CASH BONUS \ 70609 \ 11225 \ 58487 \ 6238 \ 104561 \ 14194 \ 43922 \ 4188 \ 82613 \ 11863 \ 116250 \ 13671 \ 76751 \ 7758 \ 68513 \ 20760 \ 137000 \ 55000 \ 94469 \ 34368 Mean \ 85318 \ 17927 Standard Deviation \ 28077 \ 15618 Correlation 0.735
-Comment on whether each of the following conditions for correlation / linear
regression is met.
a. Quantitative variable condition.
b. Linearity condition.
c. Outlier condition
(Essay)
4.8/5 (28)
A consumer research group investigating the relationship between the price of meat
(per pound) and the fat content (grams) gathered data that produced the following
scatterplot. 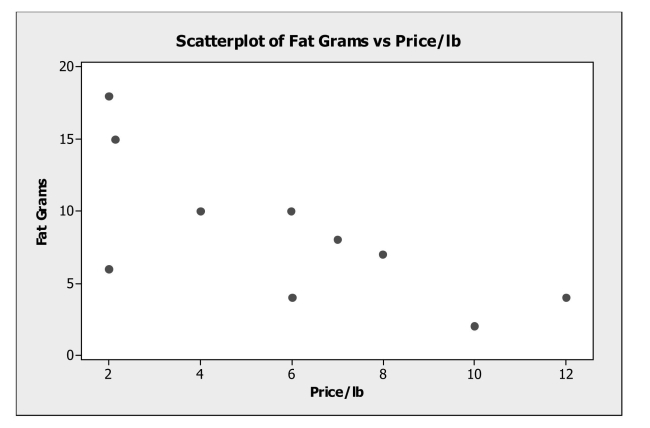 a. Describe the association between the price of meat and fat content.
b. Estimate the correlation.
c. If the point in the lower left hand corner ($2.00 per pound, 6 grams of fat) is removed,would the correlation become stronger or weaker or remain the same? Explain.
a. Describe the association between the price of meat and fat content.
b. Estimate the correlation.
c. If the point in the lower left hand corner ($2.00 per pound, 6 grams of fat) is removed,would the correlation become stronger or weaker or remain the same? Explain.
(Essay)
4.9/5 (38)
Analyze scatterplots and correlation coefficients.
-For the scatterplot shown below, the likely correlation coefficient is 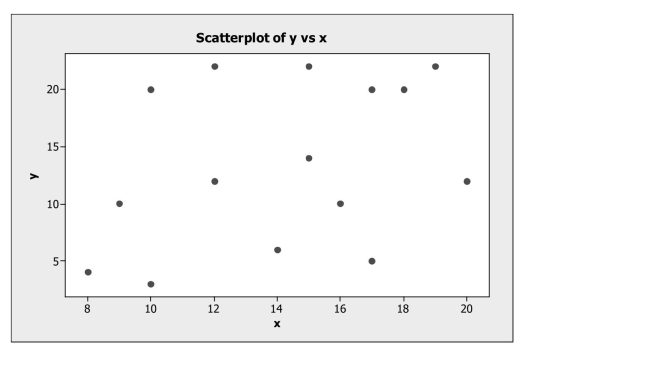
(Multiple Choice)
4.8/5 (40)
Analyze residuals.
-Linear regression was used to describe the trend in world population over time.
Below is a plot of the residuals versus predicted values. What does the plot of residuals
Suggest? 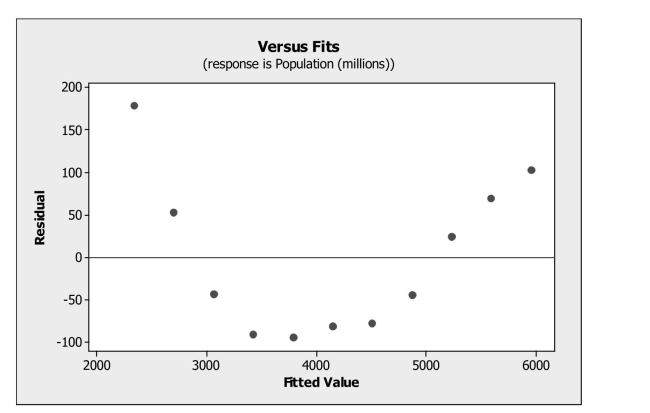
(Multiple Choice)
4.8/5 (28)
Filters
- Essay(0)
- Multiple Choice(0)
- Short Answer(0)
- True False(0)
- Matching(0)