Exam 2: Organizing and Visualizing
Exam 1: Defining and Collecting Data202 Questions
Exam 2: Organizing and Visualizing256 Questions
Exam 3: Numerical Descriptive Measures217 Questions
Exam 4: Basic Probability167 Questions
Exam 5: Discrete Probability Distributions165 Questions
Exam 6: The Normal Distribution and Other Continuous Distributions170 Questions
Exam 7: Sampling Distributions165 Questions
Exam 8: Confidence Interval Estimation219 Questions
Exam 9: Fundamentals of Hypothesis Testing: One-Sample Tests194 Questions
Exam 10: Two-Sample Tests240 Questions
Exam 11: Analysis of Variance170 Questions
Exam 12: Chi-Square and Nonparametric188 Questions
Exam 13: Simple Linear Regression243 Questions
Exam 14: Introduction to Multiple394 Questions
Exam 15: Multiple Regression146 Questions
Exam 16: Time-Series Forecasting235 Questions
Exam 17: Getting Ready to Analyze Data386 Questions
Exam 18: Statistical Applications in Quality Management159 Questions
Exam 19: Decision Making126 Questions
Exam 20: Probability and Combinatorics421 Questions
Select questions type
When constructing charts, the following is plotted at the class midpoints:
(Multiple Choice)
4.9/5  (36)
(36)
In general, a frequency distribution should have at least 8 class groups but no
more than 20.
(True/False)
4.8/5 (37)
You have collected data on the responses to two questions asked in a survey of 40 college students majoring in business-What is your gender (Male = M; Female = F) and What is your
Major (Accountancy = A; Computer Information Systems = C; Marketing = M). Which of the
Following is the best for presenting the data?
(Multiple Choice)
4.8/5 (38)
SCENARIO 2-1
An insurance company evaluates many numerical variables about a person before deciding on an
appropriate rate for automobile insurance. A representative from a local insurance agency selected a
random sample of insured drivers and recorded, X, the number of claims each made in the last 3
years, with the following results. X f 1 14 2 18 3 12 4 5 5 1
-Referring to Scenario 2-1, how many drivers are represented in the sample?
(Multiple Choice)
4.7/5 (39)
SCENARIO 2-18
The stem-and-leaf display below shows the result of a survey on 50 students on their satisfaction with
their school with the higher scores represent higher level of satisfaction. 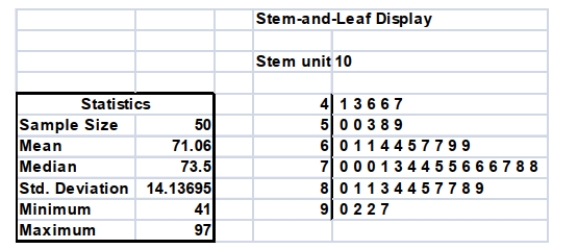 -Referring to Scenario 2-18, how many students have a satisfaction level of at least 80?
(Short Answer)
4.8/5 (32)
SCENARIO 2-14
The table below contains the number of people who own a portable Blu-ray player in a sample of 600
broken down by gender. Own a Portable Blu-ray player Male Female Yes 96 40 No 224 240
-Referring to Scenario 2-14, if the sample is a good representation of the population, we can
expect _______ percent of the population will be males.
(Short Answer)
4.8/5 (41)
SCENARIO 2-12
The table below contains the opinions of a sample of 200 people broken down by gender about the
latest congressional plan to eliminate anti-trust exemptions for professional baseball. For Neutral Against Totals Female 38 54 12 104 Male 12 36 48 96 Totals 50 90 60 200
-Referring to Scenario 2-12, if the sample is a good representation of the population, we can
expect _______ percent of those for the plan in the population will be males.
(Short Answer)
4.7/5 (42)
SCENARIO 2-12
The table below contains the opinions of a sample of 200 people broken down by gender about the
latest congressional plan to eliminate anti-trust exemptions for professional baseball. For Neutral Against Totals Female 38 54 12 104 Male 12 36 48 96 Totals 50 90 60 200
-Referring to Scenario 2-12, if the sample is a good representation of the population, we can
expect _______ percent of the population will be for the plan.
(Short Answer)
4.9/5 (32)
SCENARIO 2-6
A sample of 200 students at a Big-Ten university was taken after the midterm to ask them whether
they went bar hopping the weekend before the midterm or spent the weekend studying, and whether
they did well or poorly on the midterm. The following table contains the result. Did Well in Midterm Did Poorly in Midterm Studying for Exam 80 20 Went Bar Hopping 30 70
-Referring to Scenario 2-6, if the sample is a good representation of the population, we can expect _______ percent of those who did poorly on the midterm to have spent the weekend studying.
(Multiple Choice)
4.9/5 (37)
SCENARIO 2-19-A
You are the quality control manager of a water bottles company. One of the biggest complaints in the
past years has been the breakage and, hence, the concern on the durability of the connector between
the lid and the bottle which many users use as a handle for the bottles. To collect evidence before
implementing any modification to the production process, your department has subjected 50 water
bottles to a durability test and the following data on the number of times the handles have been used
to lift the bottles before they break are contained in the file Scenario2-19-DataA.XLSX. 495 499 502 500 491 498 498 495 488 516 513 486 504 503 493 504 489 500 495 499 501 507 511 496 486 497 510 504 493 482 511 502 520 514 486 514 500 505 512 500 504 498 503 514 474 489 488 506 517 490
-Referring to Scenario 2-19-A, construct a percentage polygon using "473 but less than 480" as
the first class.
(Essay)
4.7/5 (36)
The addition of visual elements that either fail to convey any useful information or that obscure
important points about the data in an attempt to enhance the visualization of data is called
_______.
(Short Answer)
4.8/5 (40)
A type of vertical bar chart in which the categories are plotted in the descending rank order of the magnitude of their frequencies is called a
(Multiple Choice)
4.8/5 (36)
SCENARIO 2-19-B
You are the quality control manager of a water bottles company. One of the biggest complaints in the
past years has been the breakage and, hence, the concern on the durability of the connector between
the lid and the bottle which many users use as a handle for the bottles. To collect evidence before
implementing any modification to the production process, your department has subjected 50 water
bottles to a durability test and the following data on the number of times the handles have been used
to lift the bottles before they break are contained in the file Scenario2-19-DataB.XLSX. 493 506 515 491 500 505 517 510 506 503 503 491 495 496 496 505 493 486 504 483 514 494 497 501 493 490 510 494 494 495 494 486 495 506 506 507 502 498 510 501 500 505 492 486 501 496 501 521 510 498
-Referring to Scenario 2-19-B, construct a frequency distribution using "480 but less than 487"
as the first class.
(Essay)
4.8/5 (31)
SCENARIO 2-11
The ordered array below resulted from selecting a sample of 25 batches of 500 computer chips and
determining how many in each batch were defective. Defects
1 2 4 4 5 5 6 7 9 9 12 12 15 17 20 21 23 23 25 26 27 27 28 29 29
-Referring to Scenario 2-11, construct a frequency distribution for the defects data, using "0 but
less than 5" as the first class.
(Essay)
4.8/5 (30)
SCENARIO 2-15
The figure below is the ogive for the amount of fat (in grams) for a sample of 36 pizza products
where the upper boundaries of the intervals are: 5, 10, 15, 20, 25, and 30. 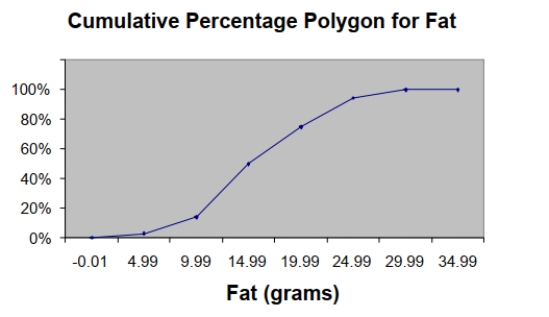 -Referring to Scenario 2-15, what percentage of pizza products contains between 10 and 25 grams of fat?
(Multiple Choice)
4.8/5 (40)
SCENARIO 2-8
The Stem-and-Leaf display represents the number of times in a year that a random sample of 100
"lifetime" members of a health club actually visited the facility. Stem Leaves 0 012222233333344566666667789999 1 1111222234444455669999 2 00011223455556889 3 0000446799 4 011345567 5 0077 6 8 7 67 8 3 9 0247
-Referring to Scenario 2-8, the person who visited the health club more than anyone else in the
sample visited the facility ________ times.
(Short Answer)
4.9/5 (30)
Relationships in a contingency table can be examined more fully if the frequencies are
converted into _______ .
(Short Answer)
4.9/5 (39)
SCENARIO 2-13
Given below is the stem-and-leaf display representing the amount of detergent used in gallons (with
leaves in 10ths of gallons) in a day by 25 drive-through car wash operations in Phoenix. 9\mid147 10\mid02238 11\mid135566777 12\mid223489 13\mid02
-Referring to Scenario 2-13, if a frequency distribution for the amount of detergent used is
constructed, using "9.0 but less than 10.0 gallons" as the first class, the frequency of the "11.0 but
less than 12.0 gallons" class would be ________.
(Short Answer)
4.8/5 (35)
A _______ is a vertical bar chart in which the rectangular bars are constructed at the boundaries
of each class interval.
(Short Answer)
4.7/5 (34)
SCENARIO 2-5
The following are the duration in minutes of a sample of long-distance phone calls made within the
continental United States reported by one long-distance carrier. Time (in Minutes) Relative Frequency 0 but less than 5 0.37 5 but less than 10 0.22 10 but less than 15 0.15 15 but less than 20 0.10 20 but less than 25 0.07 25 but less than 30 0.07 30 or more 0.02
-Referring to Scenario 2-5, if 100 calls were sampled, _______ of them would have lasted less than 5 minutes or at least 30 minutes or more.
(Multiple Choice)
4.8/5 (32)
Filters
- Essay(0)
- Multiple Choice(0)
- Short Answer(0)
- True False(0)
- Matching(0)