Exam 2: Organizing and Visualizing
Exam 1: Defining and Collecting Data202 Questions
Exam 2: Organizing and Visualizing256 Questions
Exam 3: Numerical Descriptive Measures217 Questions
Exam 4: Basic Probability167 Questions
Exam 5: Discrete Probability Distributions165 Questions
Exam 6: The Normal Distribution and Other Continuous Distributions170 Questions
Exam 7: Sampling Distributions165 Questions
Exam 8: Confidence Interval Estimation219 Questions
Exam 9: Fundamentals of Hypothesis Testing: One-Sample Tests194 Questions
Exam 10: Two-Sample Tests240 Questions
Exam 11: Analysis of Variance170 Questions
Exam 12: Chi-Square and Nonparametric188 Questions
Exam 13: Simple Linear Regression243 Questions
Exam 14: Introduction to Multiple394 Questions
Exam 15: Multiple Regression146 Questions
Exam 16: Time-Series Forecasting235 Questions
Exam 17: Getting Ready to Analyze Data386 Questions
Exam 18: Statistical Applications in Quality Management159 Questions
Exam 19: Decision Making126 Questions
Exam 20: Probability and Combinatorics421 Questions
Select questions type
SCENARIO 2-13
Given below is the stem-and-leaf display representing the amount of detergent used in gallons (with
leaves in 10ths of gallons) in a day by 25 drive-through car wash operations in Phoenix. 9\mid147 10\mid02238 11\mid135566777 12\mid223489 13\mid02
-Referring to Scenario 2-13, if a relative frequency or percentage distribution for the detergent
data is constructed, using "9.0 but less than 10.0 gallons" as the first class, what percentage of
drive-through car wash operations use at least 10 gallons of detergent in a day?
(Short Answer)
5.0/5  (41)
(41)
SCENARIO 2-9
The frequency distribution below represents the rents of 250 randomly selected federally subsidized
apartments in a small town. Rent in \ Frequency 1,100 but less than 1,200 113 1,200 but less than 1,300 85 1,300 but less than 1,400 32 1,400 but less than 1,500 16 1,500 but less than 1,600 4
-Referring to Scenario 2-9, ________ apartments rented for at least $1,200 but less than $1,400.
(Short Answer)
4.9/5 (40)
SCENARIO 2-14
The table below contains the number of people who own a portable Blu-ray player in a sample of 600
broken down by gender. Own a Portable Blu-ray player Male Female Yes 96 40 No 224 240
-Referring to Scenario 2-14, of those who owned a portable Blu-ray player in the sample,
________ percent were females.
(Short Answer)
4.8/5 (41)
Percentage polygons are plotted at the boundaries of the class groupings.
(True/False)
4.8/5 (35)
SCENARIO 2-10
The histogram below represents scores achieved by 200 job applicants on a personality profile. 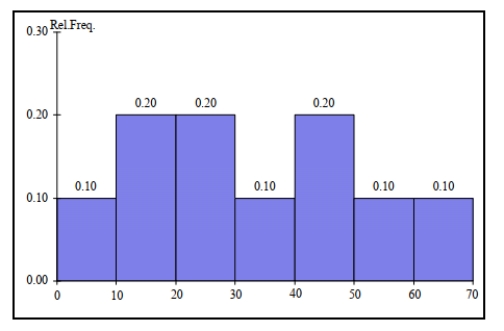 -Referring to the histogram from Scenario 2-10, _______ percent of the applicants scored below
20 or at least 50.
-Referring to the histogram from Scenario 2-10, _______ percent of the applicants scored below
20 or at least 50.
(Short Answer)
4.9/5 (27)
SCENARIO 2-14
The table below contains the number of people who own a portable Blu-ray player in a sample of 600
broken down by gender. Own a Portable Blu-ray player Male Female Yes 96 40 No 224 240
-Referring to Scenario 2-14, of the males in the sample, ________ percent owned a portable
Blu-ray player.
(Short Answer)
4.9/5 (35)
SCENARIO 2-19-A
You are the quality control manager of a water bottles company. One of the biggest complaints in the
past years has been the breakage and, hence, the concern on the durability of the connector between
the lid and the bottle which many users use as a handle for the bottles. To collect evidence before
implementing any modification to the production process, your department has subjected 50 water
bottles to a durability test and the following data on the number of times the handles have been used
to lift the bottles before they break are contained in the file Scenario2-19-DataA.XLSX. 495 499 502 500 491 498 498 495 488 516 513 486 504 503 493 504 489 500 495 499 501 507 511 496 486 497 510 504 493 482 511 502 520 514 486 514 500 505 512 500 504 498 503 514 474 489 488 506 517 490
-Referring to Scenario 2-19-A, based on the cumulative percentage polygon or cumulative
percentage distribution constructed using "473 but less than 480" as the first class, the percentage
of bottles with handles that broke after being used for lifting at least 487 times would be
________.
(Short Answer)
4.9/5 (41)
SCENARIO 2-5
The following are the duration in minutes of a sample of long-distance phone calls made within the
continental United States reported by one long-distance carrier. Time (in Minutes) Relative Frequency 0 but less than 5 0.37 5 but less than 10 0.22 10 but less than 15 0.15 15 but less than 20 0.10 20 but less than 25 0.07 25 but less than 30 0.07 30 or more 0.02
-Referring to Scenario 2-5, if 100 calls were sampled, _______of them would have lasted 20 minutes or more.
(Multiple Choice)
4.8/5 (31)
Apple Computer, Inc. collected information on the age of their customers.
Suppose the youngest customer was 12 and the oldest was 72. To study the distribution of the
age among its customers, it can use a percentage polygon.
(True/False)
5.0/5 (42)
SCENARIO 2-8
The Stem-and-Leaf display represents the number of times in a year that a random sample of 100
"lifetime" members of a health club actually visited the facility. Stem Leaves 0 012222233333344566666667789999 1 1111222234444455669999 2 00011223455556889 3 0000446799 4 011345567 5 0077 6 8 7 67 8 3 9 0247
-Referring to Scenario 2-8, if a frequency distribution with equal sized classes was made from this
data, and the first class was "0 but less than 10," the class midpoint of the third class would be
________.
(Short Answer)
4.8/5 (34)
A survey of 150 executives were asked what they think is the most common mistake candidates make during job interviews. Six different mistakes were given. Which of the
Following is the best for presenting the information?
(Multiple Choice)
5.0/5 (30)
One of the developing countries is experiencing a baby boom, with the number of births rising for the fifth year in a row, according to a BBC News report. Which of the following is best for
Displaying this data?
(Multiple Choice)
4.8/5 (34)
SCENARIO 2-14
The table below contains the number of people who own a portable Blu-ray player in a sample of 600
broken down by gender. Own a Portable Blu-ray player Male Female Yes 96 40 No 224 240
-Referring to Scenario 2-14, if the sample is a good representation of the population, we can
expect _______ percent of the females in the population will not own a portable Blu-ray player.
(Short Answer)
5.0/5 (37)
SCENARIO 2-20-B
A recent consumer survey on holiday shopping reveals the following information on the types of
stores at which consumers plan to shop (The table is also available in the file Scenario2-20-
DataB.xlsx: Types of Stores \% of Customers Stand-alone "big box" stores 54 Traditional mall 61 Local independent stores not in a mall 35 Strip mall or mini mall 25 Town hall mall 14 I do not plan to shop at any of these 9
-Referring to Scenario 20-20-B, construct a pie chart for the types of stores customers plan to
shop at.
(Essay)
4.9/5 (33)
SCENARIO 2-6
A sample of 200 students at a Big-Ten university was taken after the midterm to ask them whether
they went bar hopping the weekend before the midterm or spent the weekend studying, and whether
they did well or poorly on the midterm. The following table contains the result. Did Well in Midterm Did Poorly in Midterm Studying for Exam 80 20 Went Bar Hopping 30 70
-Referring to Scenario 2-6, if the sample is a good representation of the population, we can expect _______ percent of the students in the population to spend the weekend studying and do poorly
On the midterm.
(Multiple Choice)
4.9/5 (35)
SCENARIO 2-6
A sample of 200 students at a Big-Ten university was taken after the midterm to ask them whether
they went bar hopping the weekend before the midterm or spent the weekend studying, and whether
they did well or poorly on the midterm. The following table contains the result. Did Well in Midterm Did Poorly in Midterm Studying for Exam 80 20 Went Bar Hopping 30 70
-Referring to Scenario 2-6, if the sample is a good representation of the population, we can expect _______ percent of those who spent the weekend studying to do poorly on the midterm.
(Multiple Choice)
4.8/5 (38)
SCENARIO 2-13
Given below is the stem-and-leaf display representing the amount of detergent used in gallons (with
leaves in 10ths of gallons) in a day by 25 drive-through car wash operations in Phoenix. 9\mid147 10\mid02238 11\mid135566777 12\mid223489 13\mid02
-Referring to Scenario 2-13, construct a frequency distribution for the detergent data, using "9.0
but less than 10.0 gallons" as the first class.
(Essay)
4.9/5 (35)
SCENARIO 2-19-A
You are the quality control manager of a water bottles company. One of the biggest complaints in the
past years has been the breakage and, hence, the concern on the durability of the connector between
the lid and the bottle which many users use as a handle for the bottles. To collect evidence before
implementing any modification to the production process, your department has subjected 50 water
bottles to a durability test and the following data on the number of times the handles have been used
to lift the bottles before they break are contained in the file Scenario2-19-DataA.XLSX. 495 499 502 500 491 498 498 495 488 516 513 486 504 503 493 504 489 500 495 499 501 507 511 496 486 497 510 504 493 482 511 502 520 514 486 514 500 505 512 500 504 498 503 514 474 489 488 506 517 490
-Referring to Scenario 2-19-A, construct a frequency distribution using "473 but less than 480"
as the first class.
(Essay)
4.9/5 (39)
The Guidelines for Developing Visualizations recommend using the simplest
possible visualization.
(True/False)
4.9/5 (37)
SCENARIO 2-5
The following are the duration in minutes of a sample of long-distance phone calls made within the
continental United States reported by one long-distance carrier. Time (in Minutes) Relative Frequency 0 but less than 5 0.37 5 but less than 10 0.22 10 but less than 15 0.15 15 but less than 20 0.10 20 but less than 25 0.07 25 but less than 30 0.07 30 or more 0.02
-Referring to Scenario 2-5, what is the width of each class?
(Multiple Choice)
4.8/5 (31)
Filters
- Essay(0)
- Multiple Choice(0)
- Short Answer(0)
- True False(0)
- Matching(0)