Exam 2: Organizing and Visualizing
Exam 1: Defining and Collecting Data202 Questions
Exam 2: Organizing and Visualizing256 Questions
Exam 3: Numerical Descriptive Measures217 Questions
Exam 4: Basic Probability167 Questions
Exam 5: Discrete Probability Distributions165 Questions
Exam 6: The Normal Distribution and Other Continuous Distributions170 Questions
Exam 7: Sampling Distributions165 Questions
Exam 8: Confidence Interval Estimation219 Questions
Exam 9: Fundamentals of Hypothesis Testing: One-Sample Tests194 Questions
Exam 10: Two-Sample Tests240 Questions
Exam 11: Analysis of Variance170 Questions
Exam 12: Chi-Square and Nonparametric188 Questions
Exam 13: Simple Linear Regression243 Questions
Exam 14: Introduction to Multiple394 Questions
Exam 15: Multiple Regression146 Questions
Exam 16: Time-Series Forecasting235 Questions
Exam 17: Getting Ready to Analyze Data386 Questions
Exam 18: Statistical Applications in Quality Management159 Questions
Exam 19: Decision Making126 Questions
Exam 20: Probability and Combinatorics421 Questions
Select questions type
SCENARIO 2-20-B
A recent consumer survey on holiday shopping reveals the following information on the types of
stores at which consumers plan to shop (The table is also available in the file Scenario2-20-
DataB.xlsx: Types of Stores \% of Customers Stand-alone "big box" stores 54 Traditional mall 61 Local independent stores not in a mall 35 Strip mall or mini mall 25 Town hall mall 14 I do not plan to shop at any of these 9
-Referring to Scenario 20-20-B, construct a Pareto chart for the types of stores customers plan to
shop at.
(Essay)
4.9/5  (29)
(29)
If the values of the seventh and eighth class in a cumulative percentage
distribution are the same, we know that there are no observations in the eighth class.
(True/False)
4.8/5 (39)
SCENARIO 2-13
Given below is the stem-and-leaf display representing the amount of detergent used in gallons (with
leaves in 10ths of gallons) in a day by 25 drive-through car wash operations in Phoenix. 9\mid147 10\mid02238 11\mid135566777 12\mid223489 13\mid02
-Referring to Scenario 2-13, if a percentage histogram for the detergent data is constructed,
using "9.0 but less than 10.0 gallons" as the first class, the percentage of drive-through car wash
operations that use "12.0 but less than 13.0 gallons" of detergent would be ________.
(Short Answer)
4.8/5 (34)
Given below is the scatter plot of the price/earnings ratio versus earnings per
share of 20 U.S. companies. There appear to be a positive relationship between price/earnings
ratio and earnings per share. 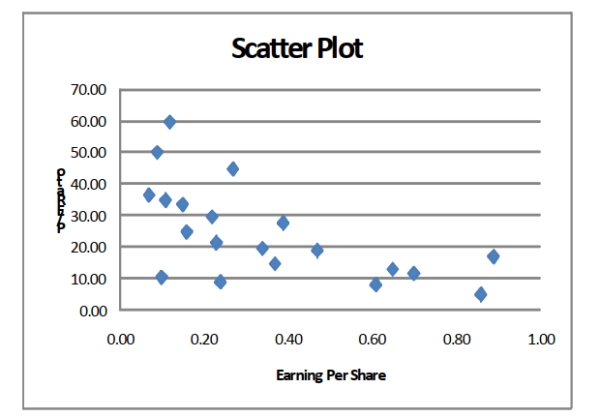
(True/False)
4.7/5 (41)
SCENARIO 2-11
The ordered array below resulted from selecting a sample of 25 batches of 500 computer chips and
determining how many in each batch were defective. Defects
1 2 4 4 5 5 6 7 9 9 12 12 15 17 20 21 23 23 25 26 27 27 28 29 29
-Referring to Scenario 2-11, construct a relative frequency or percentage distribution for the
defects data, using "0 but less than 5" as the first class.
(Essay)
4.7/5 (38)
A research analyst was directed to arrange raw data collected on the yield of wheat,
ranging from 40 to 93 bushels per acre, in a frequency distribution. He should choose 30 as the
class interval width.
(True/False)
4.9/5 (36)
SCENARIO 2-16
The figure below is the percentage polygon for the amount of calories for a sample of 36 pizzas
products where the upper limits of the intervals are: 310, 340, 370, 400 and 430. 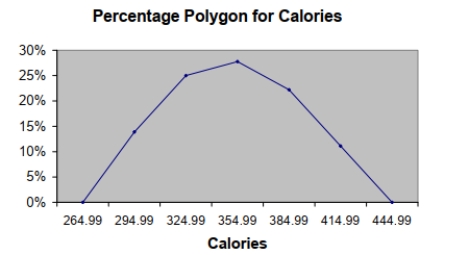 -Referring to Scenario 2-16, roughly what percentage of pizza products contains between 340 and 400 calories?
(Multiple Choice)
4.9/5 (35)
When comparing two or more large sets of numerical data, the distributions being developed
should use the same ________.
(Short Answer)
4.9/5 (44)
SCENARIO 2-5
The following are the duration in minutes of a sample of long-distance phone calls made within the
continental United States reported by one long-distance carrier. Time (in Minutes) Relative Frequency 0 but less than 5 0.37 5 but less than 10 0.22 10 but less than 15 0.15 15 but less than 20 0.10 20 but less than 25 0.07 25 but less than 30 0.07 30 or more 0.02
-Referring to Scenario 2-5, if 1,000 calls were randomly sampled, how many calls lasted under 10 minutes?
(Multiple Choice)
4.8/5 (36)
SCENARIO 2-20-B
A recent consumer survey on holiday shopping reveals the following information on the types of
stores at which consumers plan to shop (The table is also available in the file Scenario2-20-
DataB.xlsx: Types of Stores \% of Customers Stand-alone "big box" stores 54 Traditional mall 61 Local independent stores not in a mall 35 Strip mall or mini mall 25 Town hall mall 14 I do not plan to shop at any of these 9
-Referring to Scenario 20-20-B, what are the top 3 "vital few" types of stores that customers
plan to shop at.
(Essay)
4.8/5 (38)
SCENARIO 2-10
The histogram below represents scores achieved by 200 job applicants on a personality profile. 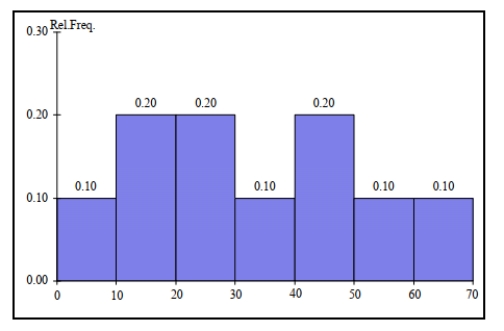 -Referring to the histogram from Scenario 2-10, the number of job applicants who scored 50 or
above is _______.
-Referring to the histogram from Scenario 2-10, the number of job applicants who scored 50 or
above is _______.
(Short Answer)
4.7/5 (30)
SCENARIO 2-13
Given below is the stem-and-leaf display representing the amount of detergent used in gallons (with
leaves in 10ths of gallons) in a day by 25 drive-through car wash operations in Phoenix. 9\mid147 10\mid02238 11\mid135566777 12\mid223489 13\mid02
-Referring to Scenario 2-13, if a percentage histogram for the detergent data is constructed,
using "9.0 but less than 10.0 gallons" as the first class, what percentage of drive-through car wash
operations use less than 12 gallons of detergent in a day?
(Short Answer)
4.8/5 (32)
SCENARIO 2-12
The table below contains the opinions of a sample of 200 people broken down by gender about the
latest congressional plan to eliminate anti-trust exemptions for professional baseball. For Neutral Against Totals Female 38 54 12 104 Male 12 36 48 96 Totals 50 90 60 200
-Referring to Scenario 2-12, if the sample is a good representation of the population, we can
expect _______ percent of the males in the population will be against the plan.
(Short Answer)
4.8/5 (44)
Given below is the scatter plot of the number of employees and the total revenue
($millions) of 20 U.S. companies. There appears to be a positive relationship between total
revenue and the number of employees. 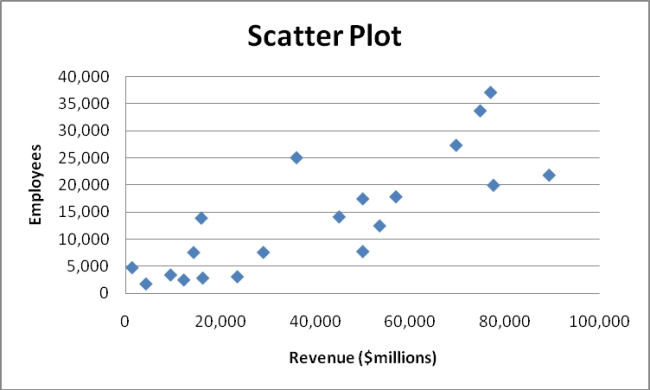
(True/False)
4.9/5 (36)
SCENARIO 2-20-A
A recent consumer survey on holiday shopping reveals the following information on the types of
stores at which consumers plan to shop (The table is also available in the file Scenario2-20-
DataA.xlsx: Types of Stores \% of Customers Stand-alone "big box" stores 63 Traditional mall 53 Local independent stores not in a mall 42 Strip mall or mini mall 27 Town hall mall 17 I do not plan to shop at any of these 12
-Referring to Scenario 2-20-A, what are the top 3 "vital few" types of stores that customers plan
to shop at.
(Essay)
4.7/5 (41)
When constructing a frequency distribution, classes should be selected so that they
are of equal width.
(True/False)
4.9/5 (39)
The Guidelines for Developing Visualizations recommend always starting the
scale for a vertical axis at zero.
(True/False)
4.8/5 (32)
SCENARIO 2-16
The figure below is the percentage polygon for the amount of calories for a sample of 36 pizzas
products where the upper limits of the intervals are: 310, 340, 370, 400 and 430.
-Referring to Scenario 2-16, roughlyCalories what percentage of pizza products contains between 400 and 430 calories?
(Multiple Choice)
4.9/5 (33)
SCENARIO 2-17
The following table presents total retail sales in millions of dollars for the leading apparel companies
over a two-year period in the past. APPAREL COMPANY Year 1 Year 2 Gap 1,159.0 962.0 TJX 781.7 899.0 Limited 596.5 620.4 Kohl's 544.9 678.9 Nordstrom 402.6 418.3 Talbots 139.9 130.1 AnnTaylor 114.2 124.8
-Referring to Scenario 2-17, among the 8 stores, _______ saw a sales decline.
(Short Answer)
4.7/5 (30)
In general, grouped frequency distributions should have between 5 and 15 class
intervals.
(True/False)
4.8/5 (38)
Filters
- Essay(0)
- Multiple Choice(0)
- Short Answer(0)
- True False(0)
- Matching(0)