Exam 2: Organizing and Visualizing
Exam 1: Defining and Collecting Data202 Questions
Exam 2: Organizing and Visualizing256 Questions
Exam 3: Numerical Descriptive Measures217 Questions
Exam 4: Basic Probability167 Questions
Exam 5: Discrete Probability Distributions165 Questions
Exam 6: The Normal Distribution and Other Continuous Distributions170 Questions
Exam 7: Sampling Distributions165 Questions
Exam 8: Confidence Interval Estimation219 Questions
Exam 9: Fundamentals of Hypothesis Testing: One-Sample Tests194 Questions
Exam 10: Two-Sample Tests240 Questions
Exam 11: Analysis of Variance170 Questions
Exam 12: Chi-Square and Nonparametric188 Questions
Exam 13: Simple Linear Regression243 Questions
Exam 14: Introduction to Multiple394 Questions
Exam 15: Multiple Regression146 Questions
Exam 16: Time-Series Forecasting235 Questions
Exam 17: Getting Ready to Analyze Data386 Questions
Exam 18: Statistical Applications in Quality Management159 Questions
Exam 19: Decision Making126 Questions
Exam 20: Probability and Combinatorics421 Questions
Select questions type
SCENARIO 2-19-B
You are the quality control manager of a water bottles company. One of the biggest complaints in the
past years has been the breakage and, hence, the concern on the durability of the connector between
the lid and the bottle which many users use as a handle for the bottles. To collect evidence before
implementing any modification to the production process, your department has subjected 50 water
bottles to a durability test and the following data on the number of times the handles have been used
to lift the bottles before they break are contained in the file Scenario2-19-DataB.XLSX. 493 506 515 491 500 505 517 510 506 503 503 491 495 496 496 505 493 486 504 483 514 494 497 501 493 490 510 494 494 495 494 486 495 506 506 507 502 498 510 501 500 505 492 486 501 496 501 521 510 498
-Referring to Scenario 2-19-B, construct a percentage polygon using "473 but less than 480" as
the first class.
(Essay)
4.8/5  (31)
(31)
SCENARIO 2-13
Given below is the stem-and-leaf display representing the amount of detergent used in gallons (with
leaves in 10ths of gallons) in a day by 25 drive-through car wash operations in Phoenix. 9\mid147 10\mid02238 11\mid135566777 12\mid223489 13\mid02
-Referring to Scenario 2-13, construct a relative frequency or percentage distribution for the
detergent data, using "9.0 but less than 10.0" as the first class.
(Essay)
4.8/5 (34)
A good choice for the number of class groups to use in constructing frequency
distribution is to have at least 5 but no more than 15 class groups.
(True/False)
4.7/5 (35)
A professor of economics at a small Texas university wanted to determine what year in school students were taking his tough economics course. Shown below is a pie chart of the results. What
Percentage of the class took the course prior to reaching their senior year? 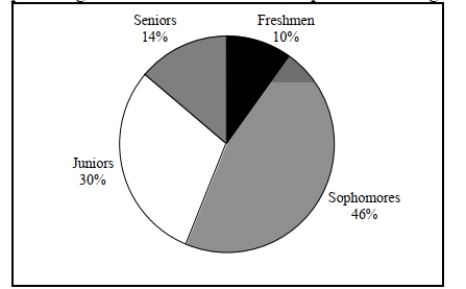
(Multiple Choice)
4.8/5 (34)
SCENARIO 2-12
The table below contains the opinions of a sample of 200 people broken down by gender about the
latest congressional plan to eliminate anti-trust exemptions for professional baseball. For Neutral Against Totals Female 38 54 12 104 Male 12 36 48 96 Totals 50 90 60 200
-Referring to Scenario 2-12, ________ percent of the 200 were females who were against the
plan.
(Short Answer)
4.8/5 (36)
SCENARIO 2-20-A
A recent consumer survey on holiday shopping reveals the following information on the types of
stores at which consumers plan to shop (The table is also available in the file Scenario2-20-
DataA.xlsx: Types of Stores \% of Customers Stand-alone "big box" stores 63 Traditional mall 53 Local independent stores not in a mall 42 Strip mall or mini mall 27 Town hall mall 17 I do not plan to shop at any of these 12
-Referring to Scenario 2-20-A, the category "I do not plan to shop at any of these" makes up
____ % of the 6 categories of shopping preferences.
(Short Answer)
4.8/5 (29)
SCENARIO 2-8
The Stem-and-Leaf display represents the number of times in a year that a random sample of 100
"lifetime" members of a health club actually visited the facility. Stem Leaves 0 012222233333344566666667789999 1 1111222234444455669999 2 00011223455556889 3 0000446799 4 011345567 5 0077 6 8 7 67 8 3 9 0247
-Referring to Scenario 2-8, the person who has the largest leaf associated with the smallest stem
visited the facility ________ times.
(Short Answer)
5.0/5 (27)
When polygons or histograms are constructed, which axis must show the true zero or "origin"?
(Multiple Choice)
4.9/5 (26)
SCENARIO 2-14
The table below contains the number of people who own a portable Blu-ray player in a sample of 600
broken down by gender. Own a Portable Blu-ray player Male Female Yes 96 40 No 224 240
-Referring to Scenario 2-14, _______ percent of the 600 did not own a portable Blu-ray player.
(Short Answer)
4.8/5 (28)
SCENARIO 2-19-A
You are the quality control manager of a water bottles company. One of the biggest complaints in the
past years has been the breakage and, hence, the concern on the durability of the connector between
the lid and the bottle which many users use as a handle for the bottles. To collect evidence before
implementing any modification to the production process, your department has subjected 50 water
bottles to a durability test and the following data on the number of times the handles have been used
to lift the bottles before they break are contained in the file Scenario2-19-DataA.XLSX. 495 499 502 500 491 498 498 495 488 516 513 486 504 503 493 504 489 500 495 499 501 507 511 496 486 497 510 504 493 482 511 502 520 514 486 514 500 505 512 500 504 498 503 514 474 489 488 506 517 490
-Referring to Scenario 2-19-A, based on the cumulative percentage polygon or cumulative
percentage distribution constructed using "473 but less than 480" as the first class, the percentage
of bottles with handles that broke after being used for lifting fewer than 494 times would be
________.
(Short Answer)
4.9/5 (23)
SCENARIO 2-19-B
You are the quality control manager of a water bottles company. One of the biggest complaints in the
past years has been the breakage and, hence, the concern on the durability of the connector between
the lid and the bottle which many users use as a handle for the bottles. To collect evidence before
implementing any modification to the production process, your department has subjected 50 water
bottles to a durability test and the following data on the number of times the handles have been used
to lift the bottles before they break are contained in the file Scenario2-19-DataB.XLSX. 493 506 515 491 500 505 517 510 506 503 503 491 495 496 496 505 493 486 504 483 514 494 497 501 493 490 510 494 494 495 494 486 495 506 506 507 502 498 510 501 500 505 492 486 501 496 501 521 510 498
-Referring to Scenario 2-19-B, based on the cumulative percentage polygon or cumulative
percentage distribution constructed using "480 but less than 487" as the first class, the percentage
of bottles with handles that broke after being used for lifting fewer than 508 times would be
________.
(Short Answer)
4.9/5 (35)
SCENARIO 2-12
The table below contains the opinions of a sample of 200 people broken down by gender about the
latest congressional plan to eliminate anti-trust exemptions for professional baseball. For Neutral Against Totals Female 38 54 12 104 Male 12 36 48 96 Totals 50 90 60 200
-Referring to Scenario 2-12, of the males in the sample, ________ percent were for the plan.
(Short Answer)
4.8/5 (39)
SCENARIO 2-14
The table below contains the number of people who own a portable Blu-ray player in a sample of 600
broken down by gender. Own a Portable Blu-ray player Male Female Yes 96 40 No 224 240
-Referring to Scenario 2-14, construct a table of row percentages.
(Essay)
4.8/5 (40)
SCENARIO 2-5
The following are the duration in minutes of a sample of long-distance phone calls made within the
continental United States reported by one long-distance carrier. Time (in Minutes) Relative Frequency 0 but less than 5 0.37 5 but less than 10 0.22 10 but less than 15 0.15 15 but less than 20 0.10 20 but less than 25 0.07 25 but less than 30 0.07 30 or more 0.02
-Referring to Scenario 2-5, if 100 calls were randomly sampled, how many calls lasted 15 minutes or longer?
(Multiple Choice)
4.9/5 (36)
SCENARIO 2-9
The frequency distribution below represents the rents of 250 randomly selected federally subsidized
apartments in a small town. Rent in \ Frequency 1,100 but less than 1,200 113 1,200 but less than 1,300 85 1,300 but less than 1,400 32 1,400 but less than 1,500 16 1,500 but less than 1,600 4
-Referring to Scenario 2-9, the percentage of apartments renting for less than $1,400 is ________.
(Short Answer)
4.7/5 (37)
SCENARIO 2-11
The ordered array below resulted from selecting a sample of 25 batches of 500 computer chips and
determining how many in each batch were defective. Defects
1 2 4 4 5 5 6 7 9 9 12 12 15 17 20 21 23 23 25 26 27 27 28 29 29
-Referring to Scenario 2-11, if a frequency distribution for the defects data is constructed, using "0
but less than 5" as the first class, the relative frequency of the "15 but less than 20" class would
be ________.
(Short Answer)
4.8/5 (31)
SCENARIO 2-14
The table below contains the number of people who own a portable Blu-ray player in a sample of 600
broken down by gender. Own a Portable Blu-ray player Male Female Yes 96 40 No 224 240
-Referring to Scenario 2-14, of those who did not own a portable Blu-ray player in the sample,
________ percent were males.
(Short Answer)
4.7/5 (40)
SCENARIO 2-20-A
A recent consumer survey on holiday shopping reveals the following information on the types of
stores at which consumers plan to shop (The table is also available in the file Scenario2-20-
DataA.xlsx: Types of Stores \% of Customers Stand-alone "big box" stores 63 Traditional mall 53 Local independent stores not in a mall 42 Strip mall or mini mall 27 Town hall mall 17 I do not plan to shop at any of these 12
-Referring to Scenario 2-20-A, construct a bar chart for the types of stores customers plan to
shop at.
(Essay)
4.8/5 (32)
Filters
- Essay(0)
- Multiple Choice(0)
- Short Answer(0)
- True False(0)
- Matching(0)