Exam 7: Correlation and Causality
Exam 1: Speaking of Statistics170 Questions
Exam 2: Measurement in Statistics138 Questions
Exam 3: Visual Displays of Data115 Questions
Exam 4: Describing Data120 Questions
Exam 5: A Normal World54 Questions
Exam 6: Probability in Statistics119 Questions
Exam 7: Correlation and Causality55 Questions
Exam 8: Inferences From Samples to Populations100 Questions
Exam 9: Hypothesis Testing71 Questions
Exam 10: T Tests, Two-Way Tables, and Anova50 Questions
Select questions type
To get the best deal on a microwave oven, Amanda called six appliance stores and asked the cost and volume of several models. The prices and volumes she was quoted are listed below. Amanda later learned that the group of 3 microwaves with volumes greater than 1 cubic foot and costing less than $200 were discontinued models Priced lower than normal. How does this change your view of the correlation? Volume (cu.ft) Price (\ ) 1.5 17 0.7 49 1.5 349 1.9 183 0.5 119 2.2 119 1.8 417 1.5 463 1 200
Free
(Multiple Choice)
4.8/5  (31)
(31)
Correct Answer: Verified
D
Select the best-fit line for the data on the scatter diagram. If none of the lines fit the data, write "none of the lines".
-Select the best-fit line on the scatter diagram below. 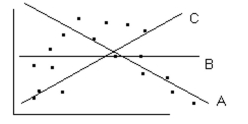
Free
(Multiple Choice)
4.8/5 (35)
Correct Answer:Verified
D
To get the best deal on a microwave oven, Amanda called six appliance stores and asked the cost and volume of several models. The prices and volumes she was quoted are listed below. Estimate or compute the correlation
Coefficient. Volume (cu.ft) Price (\ ) 0.5 119 2.2 119 1.8 417 1.5 463 1 200 1.5 17 0.7 49 1.5 349 1.9 183
Free
(Multiple Choice)
4.7/5 (32)
Correct Answer:Verified
B
Solve the problem.
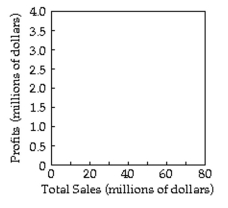
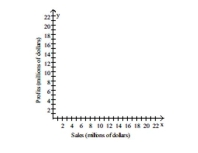
-The following table gives the total sales (revenue)and profits for 8 retailers. Construct a scatter diagram for thedata and state whether sales and profits for these companies have no correlation, a positive correlation, or a
Negative correlation.
(Multiple Choice)
4.8/5 (36)
State whether there is no correlation, a positive correlation, or a negative correlation between the x and y variables. If there is a correlation, state whether it is most likely due to coincidence, a common underlying cause, or a direct cause.
- For a group of employees at the local video store, the scatter diagram compares the number of days worked per year (y)and the average number of miles walkedweekly (x).
(Multiple Choice)
4.9/5 (32)
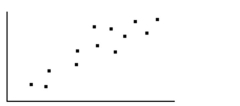
Select the best estimate of the correlation coefficient for the data depicted in the scatter diagram.
-
(Multiple Choice)
4.9/5 (39)
Solve the problem.
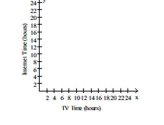
-The table below shows the times (in hours)that seven students spend watching television and using the internet. Construct a scatter diagram for the data and state whether these times have no correlation, a positive correlation, or a negative correlation.
Student TV TimeInternet Time (hours) (hours) Tom 9 6 Dick 5 4 Harry 3 0 Sue 8 9 Betty 8 10 Erin 6 1 Jan 7 10
(Multiple Choice)
4.8/5 (36)
State whether you believe the two variables are correlated. If you believe they are correlated, state whether the correlation is positive or negative.
-Rate of pedaling a bicycle and speed of the bicycle
(Multiple Choice)
4.8/5 (37)
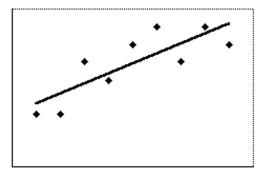
Select the best-fit line for the data on the scatter diagram. If none of the lines fit the data, write "none of the lines".
-Select the best-fit line on the scatter diagram below. 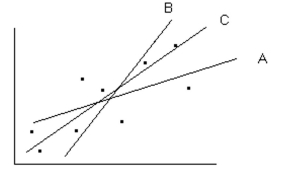
(Multiple Choice)
4.9/5 (38)
Select the best estimate of the correlation coefficient for the data depicted in the scatter diagram.
-
(Multiple Choice)
4.9/5 (44)
The table contains the weights (in pounds)and heights (in inches)of 9 randomly selected adults. Construct a scatter diagram for the data.
Weight (lb) Height (in.) 125 60 130 62 128 70 130 65 155 75 150 72 135 68 145 68 145 65
(Essay)
4.8/5 (32)
Solve the problem.
-The table below shows the sales and profits of a company from 2000 to 2005. Construct a scatter diagram for the data and state whether sales and profits for this company have no correlation, a positive correlation, or a negative correlation for this period.
(Multiple Choice)
4.7/5 (31)
Provide an appropriate response.
-Estimate the coordinates of the outlier on the graph. 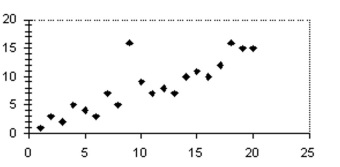
(Multiple Choice)
4.7/5 (40)
State whether there is no correlation, a positive correlation, or a negative correlation between the x and y variables. If there is a correlation, state whether it is most likely due to coincidence, a common underlying cause, or a direct cause.
- For several customers at the local bookstore, the scatter diagram compares the weight of their books (y)and the umber of pages in them(x).
(Multiple Choice)
4.9/5 (36)
State whether there is no correlation, a positive correlation, or a negative correlation between the x and y variables. If there is a correlation, state whether it is most likely due to coincidence, a common underlying cause, or a direct cause.
- For a group of students in a statistics class, the scatter diagram compares their test scores (y)and the amount of loose pocket change they have(x).
(Multiple Choice)
4.9/5 (40)
Construct a scatter diagram with several groups of data such that there is no correlation of data within the groups and no correlation among all the data. 
(Multiple Choice)
4.8/5 (35)
Construct a scatter diagram with two groups of data that have no correlation within either group but shows a moderate correlation among all the data. 
(Multiple Choice)
4.8/5 (34)
Solve the problem.
-A study found a strong correlation between excessive red meat consumption and cholesterol problems . If excessive red meat consumption causes cholesterol problems , how could some of the people in the study frequently eat red meat and yet show no signs of cholesterol problems ?
(Essay)
4.7/5 (29)
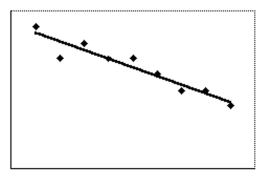
Answer the question using the value of r and the given best-fit line on the scatter diagram.
-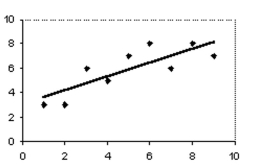 The scatter diagram and best-fit line show the data for the price of a stock (y)and U.S. employment (x). The correlation coefficient r is 0.8. Predict the stock price for an employment value of 5.
(Multiple Choice)
4.8/5 (39)
Solve the problem.
-A local highway has an express lane that contains no exits and runs parallel to the other lanes for five miles before merging back with them. A study found that during rush hour traffic, driving times in the express lane were strongly correlated with the longest travel times over the five mile stretch in question. One driver commented that the express lane causes traffic slowdowns and was a waste of money. Comment on how persuasive this comment is and how additional research could help.
(Essay)
4.8/5 (32)
Filters
- Essay(0)
- Multiple Choice(0)
- Short Answer(0)
- True False(0)
- Matching(0)