Exam 7: Correlation and Causality
Exam 1: Speaking of Statistics170 Questions
Exam 2: Measurement in Statistics138 Questions
Exam 3: Visual Displays of Data115 Questions
Exam 4: Describing Data120 Questions
Exam 5: A Normal World54 Questions
Exam 6: Probability in Statistics119 Questions
Exam 7: Correlation and Causality55 Questions
Exam 8: Inferences From Samples to Populations100 Questions
Exam 9: Hypothesis Testing71 Questions
Exam 10: T Tests, Two-Way Tables, and Anova50 Questions
Select questions type
Write possible coordinates for the single outlier such that it would no longer be an outlier. 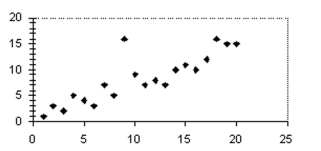
(Multiple Choice)
4.9/5  (40)
(40)
Select the best-fit line for the data on the scatter diagram. If none of the lines fit the data, write "none of the lines".
-Select the best-fit line on the scatter diagram below. 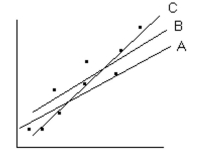
(Multiple Choice)
4.8/5 (39)
Solve the problem. Round your answers to the nearest whole percent.
- The scatter diagram shows the data for the prices of a stock (y) and U.S. employment (x). The correlation coeffici . Determine how much of the variation in the stock price can be accounted for by the best-fit line.
(Multiple Choice)
4.8/5 (37)
Answer the question using the value of r and the given best-fit line on the scatter diagram.
- The scatter diagram and best-fit line show the data for the price of a stock (y)and U.S. employment (x). The correlation coefficient r is 0.8. Predict the stock price for an employment value of 11.
(Multiple Choice)
4.7/5 (36)
State whether you believe the two variables are correlated. If you believe they are correlated, state whether the correlation is positive or negative.
-The time it takes to read a book and the length of the book
(Multiple Choice)
4.8/5 (44)
Solve the problem.
-There is a strong correlation between the number of homicides and the number of gas stations in a town. Local activists claim that building more gas stations will cause the homicide rate to rise. Evaluate the claim of causality.
(Essay)
4.8/5 (32)
The table contains the weights (in pounds)and heights (in inches)of 9 randomly selected adults. Estimate or compute the correlation coefficient. Weight (lb) Height (in.) 150 72 135 68 145 68 145 65 125 60 130 62 128 70 130 65 155 75
(Multiple Choice)
4.8/5 (33)
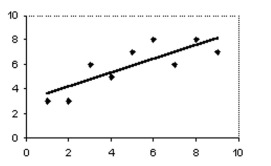
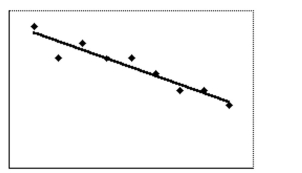
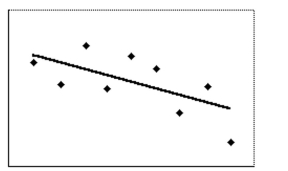
Select the best-fit line for the data on the scatter diagram. If none of the lines fit the data, write "none of the lines".
-Select the best-fit line on the scatter diagram below. 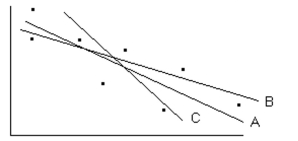
(Multiple Choice)
4.9/5 (39)
Determine whether the stated causal connection is valid or not valid.
-The fuel economy of a car is affected by the car's type of upholstery.
(Multiple Choice)
4.9/5 (34)
Determine whether the stated causal connection is valid or not valid.
-The fuel economy of a car is affected by the car's engine size.
(Multiple Choice)
4.8/5 (38)
Including the outlier, estimate or compute the correlation coefficient for the complete data set. 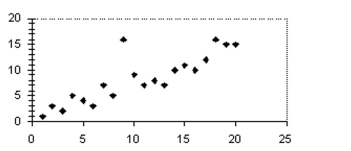
(Multiple Choice)
4.9/5 (43)
State whether you believe the two variables are correlated. If you believe they are correlated, state whether the correlation is positive or negative.
-The number of hours one sleeps and the number of hours one is awake
(Multiple Choice)
4.8/5 (31)
Solve the problem.
-A reporter studied the causes of household fires in his town and found a strong correlation between the damages (in dollars)and the number of fire trucks at the scene. The reporter's newspaper ran a headline claiming that using more fire trucks at the scene seems to cause more harm than good. Is the newspaper right in
their claim?
(Essay)
4.7/5 (30)
State whether you believe the two variables are correlated. If you believe they are correlated, state whether the correlation is positive or negative.
-The age of a textbook and how well it is written
(Multiple Choice)
4.8/5 (42)
Solve the problem. Round your answers to the nearest whole percent.
- The scatter diagram shows the data for price per item (y)and the availability of that item (x). The correlation coefficient r
Is -0.95. Determine how much of the variation in price per item can be accounted for by the best-fit line.
The scatter diagram shows the data for price per item (y)and the availability of that item (x). The correlation coefficient r
Is -0.95. Determine how much of the variation in price per item can be accounted for by the best-fit line.
(Multiple Choice)
4.7/5 (42)
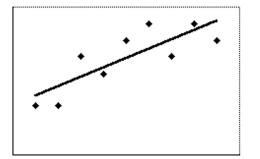
Select the best estimate of the correlation coefficient for the data depicted in the scatter diagram.
-
(Multiple Choice)
4.9/5 (39)
The table contains the weights (in pounds)and heights (in inches)of 9 randomly selected adults. You learn that the five smallest weights were all women. How does this change your view of the correlation? Weight (lb) Height (in.) 128 70 130 65 155 75 150 72 135 68 145 68 145 65 125 60 130 62
(Essay)
4.8/5 (37)
Answer the question using the value of r and the given best-fit line on the scatter diagram.
-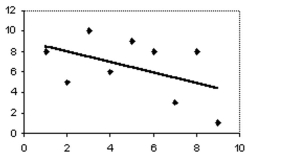 The scatter diagram and best-fit line show the data for the number of cars waiting by a school (y)and the amount of time after the end of classes (x). The correlation coefficient r is -0.55. Predict the number of cars at time 8
After the end of classes.
The scatter diagram and best-fit line show the data for the number of cars waiting by a school (y)and the amount of time after the end of classes (x). The correlation coefficient r is -0.55. Predict the number of cars at time 8
After the end of classes.
(Multiple Choice)
4.7/5 (34)
Construct a scatter diagram with several groups of uncorrelated data but a strong correlation among all the data.
(Multiple Choice)
4.8/5 (34)
Determine whether the stated causal connection is valid or not valid.
-Alcohol intoxication can be prevented by drinking light beer.
(Multiple Choice)
5.0/5 (44)
Filters
- Essay(0)
- Multiple Choice(0)
- Short Answer(0)
- True False(0)
- Matching(0)