Exam 7: Correlation and Causality
Exam 1: Speaking of Statistics170 Questions
Exam 2: Measurement in Statistics138 Questions
Exam 3: Visual Displays of Data115 Questions
Exam 4: Describing Data120 Questions
Exam 5: A Normal World54 Questions
Exam 6: Probability in Statistics119 Questions
Exam 7: Correlation and Causality55 Questions
Exam 8: Inferences From Samples to Populations100 Questions
Exam 9: Hypothesis Testing71 Questions
Exam 10: T Tests, Two-Way Tables, and Anova50 Questions
Select questions type
To get the best deal on a microwave oven, Amanda called six appliance stores and asked the cost and volume of several models. The prices and volumes she was quoted are listed below. Construct a scatter diagram for the data.

(Essay)
4.8/5  (29)
(29)
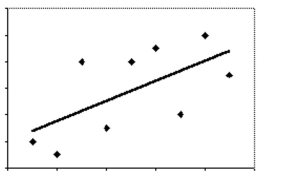
Answer the question using the value of r and the given best-fit line on the scatter diagram.
-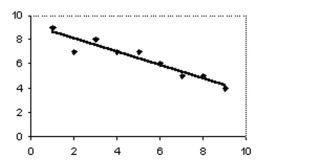 The scatter diagram and best-fit line show the data for price per item (y)and the availability of that item (x). The correlation coefficient r is -0.95. Predict the price per item for an availability of 3.
(Multiple Choice)
4.8/5 (37)
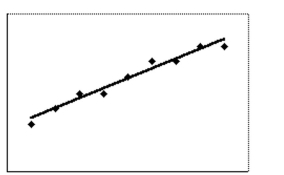
Select the best estimate of the correlation coefficient for the data depicted in the scatter diagram.
-
(Multiple Choice)
4.9/5 (44)
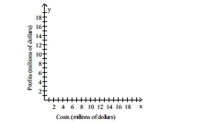
Solve the problem.
-The table below shows the legal costs and the profits of a company from 2000 to 2005. Construct a scatter diagram for the data and state whether legal costs and profits for this company have no correlation, a positive correlation, or a negative correlation for this period.
(Multiple Choice)
4.7/5 (37)
Solve the problem. Round your answers to the nearest whole percent.
-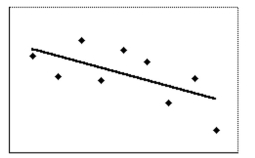 The scatter diagram shows the data for the number of cars waiting by a school (y) and the amount of time after tl of classes (x). The correlation coefficient is . Determine how much of the variation in the number of wait cars can be accounted for by the best-fit line.
(Multiple Choice)
4.9/5 (37)
State whether you believe the two variables are correlated. If you believe they are correlated, state whether the correlation is positive or negative.
-Time spent walking and distance covered
(Multiple Choice)
4.9/5 (36)
Write possible coordinates for both outliers so that neither would be an outlier. 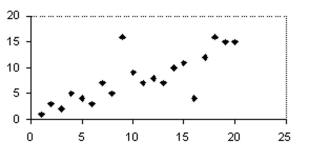
(Multiple Choice)
4.8/5 (41)
State whether you believe the two variables are correlated. If you believe they are correlated, state whether the correlation is positive or negative.
-The age of a car and its fuel efficiency.
(Multiple Choice)
4.8/5 (35)
Construct a scatter diagram with two groups of data, correlations within each group, but no correlation among all the data.
(Multiple Choice)
4.8/5 (30)
Write the coordinates of a point that would be an outlier on the following graph. 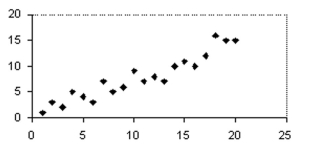
(Multiple Choice)
4.9/5 (40)
Solve the problem. Round your answers to the nearest whole percent.
- The scatter diagram shows the data for attendance at the local team's hockey games (y)and the number of wins (x)for
That team. The correlation coefficient r is 0.4. Determine how much of the variation in attendance can be accounted for
By the best-fit line.
The scatter diagram shows the data for attendance at the local team's hockey games (y)and the number of wins (x)for
That team. The correlation coefficient r is 0.4. Determine how much of the variation in attendance can be accounted for
By the best-fit line.
(Multiple Choice)
4.9/5 (43)
Determine whether the stated causal connection is valid or not valid.
-Long-distance hikers sometimes get blisters on their feet.
(Multiple Choice)
4.9/5 (32)
Determine whether the stated causal connection is valid or not valid.
-The distance that a hit golf ball travels is caused by the strength of the golfer.
(Multiple Choice)
4.8/5 (35)
State whether there is no correlation, a positive correlation, or a negative correlation between the x and y variables. If there is a correlation, state whether it is most likely due to coincidence, a common underlying cause, or a direct cause.
- For a group of English students at the local junior college, the scatter diagram compares the number of correct answers on a test they took(y)and the length of the pencil used to take the test(x).
(Multiple Choice)
4.7/5 (41)
Filters
- Essay(0)
- Multiple Choice(0)
- Short Answer(0)
- True False(0)
- Matching(0)