Exam 3: Visual Displays of Data
Exam 1: Speaking of Statistics170 Questions
Exam 2: Measurement in Statistics138 Questions
Exam 3: Visual Displays of Data115 Questions
Exam 4: Describing Data120 Questions
Exam 5: A Normal World54 Questions
Exam 6: Probability in Statistics119 Questions
Exam 7: Correlation and Causality55 Questions
Exam 8: Inferences From Samples to Populations100 Questions
Exam 9: Hypothesis Testing71 Questions
Exam 10: T Tests, Two-Way Tables, and Anova50 Questions
Select questions type
A teacher asked each of her students how many novels they had read in the previous six months. The results are
Shown below. 0 1 5 4 2 1 3 2 2 7 2 5 0 1 0 1 1 2 6 0 2 3 1 2 7 1 4 2 3 1 7 0 0 2 1 1 0 6 1 7
Create a frequency table for the number of novels read.
(Multiple Choice)
4.7/5  (37)
(37)
The table shows the country represented by the winner of the 10,000 meter run in the Summer Olympic Games in various years. Create a frequency table for the number of winners of the 10,000 meter run. Year Country Year Country 1912 Finland 1960 USSR 1920 Finland 1964 United States 1924 Finland 1968 Kenya 1928 Finland 1972 Finland 1932 Poland 1976 Finland 1936 Finland 1980 Ethiopia 1948 Czechoslovakia 1984 Italy 1952 Czechoslovakia 1988 Morocco 1956 USSR 1992 Morocco
(Multiple Choice)
4.8/5 (39)
Construct the requested histogram.
-In a college health course, 65 students participated in a physical fitness assessment. One measure used in the assessment was body fat. The body fat percentages for the 65 students is given below. Create a histogram of the data using bins that are 2% wide.
12 17 19 22 19 26 15 14 22 11 22 25 27 13 24 14 16 28 27 16 25 27 15 17 30 14 28 28 24 29 24 10 23 35 12 16 25 13 23 25 28 27 24 27 27 12 18 24 17 17 22 26 17 31 25 23 25 26 12 14 17 15 16 19 14
(Essay)
5.0/5 (39)
Provide the appropriate response.
-A manufacturer records the number of errors each work station makes during the week. The data are as follows.
6 3 2 3 5 2 0 2 5 4 2 0 1
Create a dot plot for this data. 
(Multiple Choice)
4.9/5 (31)
Construct a line chart for the data.
-A medical research team studied the ages of patients who had strokes caused by stress. The results of 34
Patients are as follows: Age (years) Frequency 23-27 3 28-32 3 33-37 6 38-42 4 43-47 5 48-52 3 53-57 5 58-62 5
(Multiple Choice)
4.9/5 (37)
Andrew creates a bar graph to show the increase in his company's sales. He wants to show the milestones - years in which sales reached 10 million, 20 million, 30 million, 40 million, and 50 million dollars respectively.
The data are shown in the table below:
Year Sales (millions of dollars) 1975 10 1985 20 1993 30 1999 40 2003 50
In the graph, Andrew draws 5 equally spaced bars of heights 1 in, 2 in, 3 in, 4 in, and 5 in respectively. The height of each bar corresponds to the amount of sales. He labels each bar with the corresponding year (1975, 1985, 1993, 1999,
2003 respectively). Why is the graph misleading?
(Essay)
5.0/5 (31)
Solve the problem.
-Twenty-four workers were surveyed about how long it takes them to travel to work each day. The data below are given in minutes.
20 35 42 52 65 20 60 49 24 37 23 24
22 20 41 25 28 27 50 47 58 30 32 48
Use the data to construct a stem-and-leaf plot.
(Multiple Choice)
4.8/5 (41)
Construct the requested histogram.
-The following frequency table shows the body temperatures (°F)of randomly selected subjects. Use the frequency table to construct the corresponding histogram.
Temperature Frequency 96.9-97.2 2 97.3-97.6 3 97.7-98.0 5 98.1-98.4 12 98.5-98.8 14 98.9-99.2 3 99.3-99.6 1
(Essay)
4.7/5 (35)
The stem-and-leaf diagram below shows the highest wind velocity ever recorded in 30 different U.S. cities. The velocities are given in miles per hour. The leaf unit is 1.0.
6 4 7 23 7 589 8 0111344 8 5568899 9 0012234 9 559
How many of the maximum wind velocities are 85 miles per hour or higher?
(Multiple Choice)
4.8/5 (35)
Provide an appropriate response.
-Suppose that you construct a histogram and a relative frequency histogram corresponding to a particular frequency table. In what ways will the two histograms be similar? In what ways will they differ?
(Essay)
4.8/5 (38)
Solve the problem.
-Wagenlucht Ice Cream Company is always trying to create new flavors of ice cream. They are market testing three kinds to find out which one has the best chance by of becoming popular. They give small samples of each to 50 people at a grocery store. 10 ice cream tasters preferred the Strawberry Cream, 30 preferred Choco-Nuts, and 10 loved the Orange Mint. Construct a Pareto chart to represent these preferences as percentages.
(Multiple Choice)
4.9/5 (32)
The stacked line chart shows the value of each of Danny's investments. The stacked line chart contains three regions. The uppermost unshaded region represents the value of Danny's investment in individual stocks. The center shaded region represents the value of Danny's investment in mutual funds and the bottom region in black represents the value of Danny's investment in a CD. The thickness of a region at a particular time tells you its value at that time. 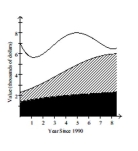 Use the graph to answer the question.
-In which year was the total value of Danny's investments the greatest?
Use the graph to answer the question.
-In which year was the total value of Danny's investments the greatest?
(Multiple Choice)
4.8/5 (40)
The stacked line chart shows the value of each of Danny's investments. The stacked line chart contains three regions. The uppermost unshaded region represents the value of Danny's investment in individual stocks. The center shaded region represents the value of Danny's investment in mutual funds and the bottom region in black represents the value of Danny's investment in a CD. The thickness of a region at a particular time tells you its value at that time. Use the graph to answer the question.
-In the year 1998, approximately what percentage of Danny's total investment was in mutual funds?
(Multiple Choice)
4.9/5 (40)
Provide an appropriate response.
-The frequency table shows the heights (in inches)of 80 professional basketball players.
Height (inches) Frequency 69.0-71.9 19 72.0-74.9 14 75.0-77.9 20 78.0-80.9 14 81.0-83.9 13
Create a cumulative frequency table for the data.
(Multiple Choice)
4.8/5 (39)
Solve the problem.
-The Kappa Iota Sigma Fraternity polled its members on the weekend party theme. The vote was as follows: six for toga, four for hayride, eight for school spirit, and two for masquerade. Display the vote count in a Pareto chart.
(Multiple Choice)
4.8/5 (37)
Filters
- Essay(0)
- Multiple Choice(0)
- Short Answer(0)
- True False(0)
- Matching(0)