Exam 3: Visual Displays of Data
Exam 1: Speaking of Statistics170 Questions
Exam 2: Measurement in Statistics138 Questions
Exam 3: Visual Displays of Data115 Questions
Exam 4: Describing Data120 Questions
Exam 5: A Normal World54 Questions
Exam 6: Probability in Statistics119 Questions
Exam 7: Correlation and Causality55 Questions
Exam 8: Inferences From Samples to Populations100 Questions
Exam 9: Hypothesis Testing71 Questions
Exam 10: T Tests, Two-Way Tables, and Anova50 Questions
Select questions type
Use the graph to answer the question.
-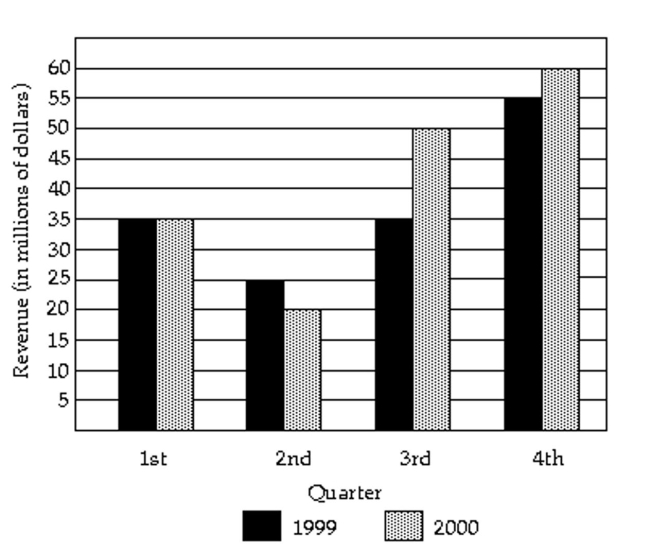 In what quarter was the revenue the least for 2000?
(Multiple Choice)
4.9/5  (46)
(46)
A nurse measured the blood pressure of each person who visited her clinic. Following is a relative-frequency histogram for the systolic blood pressure readings for those people aged between 25 and 40. Use the histogram to answer the question. The blood pressure readings were given to the nearest whole number. 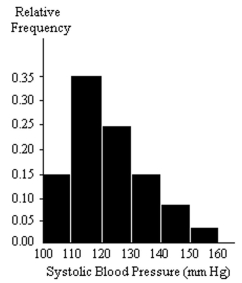 -Given that 600 people were aged between 25 and 40, approximately how many had a systolic blood pressure reading between 130 and 149 inclusive?
(Multiple Choice)
5.0/5 (36)
A parcel delivery service lowered its prices and finds that it has delivered twice as many parcels this year as it did last year. To illustrate this fact, the manager draws a pictogram as shown below. Each cube depicts a parcel. The side length of the "parcel" on the right is twice the side length of the "parcel" on the left. 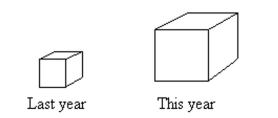 Why is this pictogram misleading? What visual impression is portrayed by the pictogram?
(Essay)
4.9/5 (39)
The stacked line chart shows the value of each of Danny's investments. The stacked line chart contains three regions. The uppermost unshaded region represents the value of Danny's investment in individual stocks. The center shaded region represents the value of Danny's investment in mutual funds and the bottom region in black represents the value of Danny's investment in a CD. The thickness of a region at a particular time tells you its value at that time. 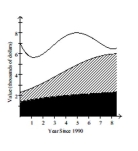 Use the graph to answer the question.
-In the year 1990, approximately what percentage of Danny's total investment was in the CD?
Use the graph to answer the question.
-In the year 1990, approximately what percentage of Danny's total investment was in the CD?
(Multiple Choice)
4.9/5 (48)
A nurse measured the blood pressure of each person who visited her clinic. Following is a relative-frequency histogram for the systolic blood pressure readings for those people aged between 25 and 40. Use the histogram to answer the question. The blood pressure readings were given to the nearest whole number.
-What common class width was used to construct the frequency distribution?
(Multiple Choice)
4.9/5 (37)
Construct a frequency table for the weights (in ounces)given below of 40 packages of candy. Start the first bin
At 1.600 ounces and use a bin width of 0.010 ounce. 1.636 1.646 1.622 1.646 1.631 1.600 1.651 1.666 1.612 1.650 1.671 1.640 1.604 1.646 1.646 1.620 1.671 1.644 1.626 1.616 1.639 1.642 1.630 1.632 1.636 1.652 1.640 1.664 1.672 1.664 1.662 1.651 1.650 1.636 1.644 1.641 1.626 1.656 1.614 1.646
(Multiple Choice)
4.8/5 (41)
Construct a pie chart representing the given data set.
-The data below represent the results of a poll in which the following question was asked: "To what degree are you
Satisfied with your current health insurance?"
Very
Somewhat
Not at All
No opinion
(Multiple Choice)
4.9/5 (38)
Answer the question using the graphical display. 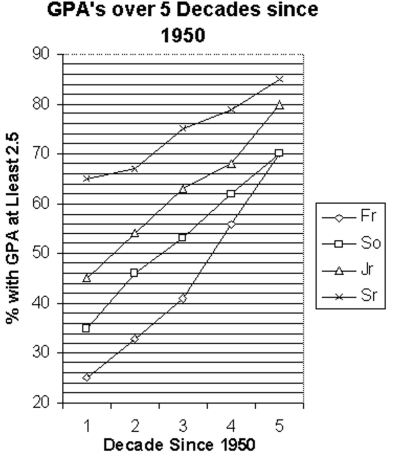 -Identify the class that has had the greatest percentage increase with respect to its initial percentage over the five decades.
(Multiple Choice)
4.8/5 (31)
A nurse measured the blood pressure of each person who visited her clinic. Following is a relative-frequency histogram for the systolic blood pressure readings for those people aged between 25 and 40. Use the histogram to answer the question. The blood pressure readings were given to the nearest whole number.
-Given that 800 people were aged between 25 and 40, approximately how many had a systolic blood pressure reading between 140 and 149 inclusive?
(Multiple Choice)
4.8/5 (40)
Provide the appropriate response.
-The following dot plot represents the ages of the customers who visited a sporting goods store on a particular
Monday. 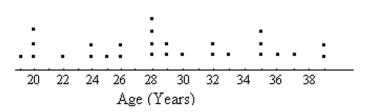 How many people in the sample were aged between 20 and 28, inclusive?
(Multiple Choice)
4.7/5 (36)
A car insurance company conducted a survey to find out how many car accidents people had been involved in.
They selected a sample of 32 adults between the ages of 30 and 70 and asked each person how many accidents
They had been involved in in the past ten years. The following data were obtained. 0 1 0 3 2 1 0 2 1 1 1 0 2 0 4 1 2 0 0 1 0 2 1 3 1 3 0 0 1 0 5 4
Create a frequency table for the number of car accidents.
(Multiple Choice)
4.8/5 (38)
Provide an appropriate response.
-Explain the difference between a frequency distribution and a relative frequency distribution. Comment on the differences on the vertical axis scale. Given the same data set and the same classes, will the shapes of the frequency distribution and the relative frequency distribution be the same? You may draw a diagram to support your answer.
(Essay)
4.7/5 (34)
Answer the question using the graphical display. 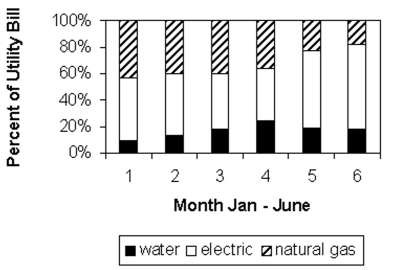 -Identify the utility that accounts for over half the total bill in two months.
(Multiple Choice)
4.7/5 (38)
Construct the requested table. Round relative frequencies to the nearest hundredth of a percent, unless otherwise indicated.
-On Monday mornings, a bookie tabulates the point spreads for the basketball games played on Saturday and sunday. He found that 2 games had a spread of 1 or 2 points, 4 had a spread of 3 to 6 points, 3 had a spread of 7 To 10, and 3 were more than 10. Construct the relative frequency table the bookie obtained for the weekend
Basketball games.
(Multiple Choice)
4.8/5 (30)
A nurse measured the blood pressure of each person who visited her clinic. Following is a relative-frequency histogram for the systolic blood pressure readings for those people aged between 25 and 40. Use the histogram to answer the question. The blood pressure readings were given to the nearest whole number.
-Given that 700 people were aged between 25 and 40, approximately how many had a systolic blood pressure reading of 140 or higher?
(Multiple Choice)
4.8/5 (35)
Make a bar graph to represent the data.
-The following table shows the number of male infants born at Hospital X on New Year's Day (Jan. 1). Create a bar graph for the data.
No. of Male Year Infants Born on Jan 1 1980 12 1981 28 1982 20 1983 32 1984 20 1985 20
(Essay)
4.9/5 (42)
Solve the problem.
-200 casino patrons, were interviewed as they left the casino. 60 of them said they spent most of the time playing the slots. 60 of them said they played blackjack. 30 said they played craps. 10 said roulette. 10 said poker. The rest were not sure what they played the most. Construct a Pareto chart to depict the gaming practices of the group of casino goers as percentages.
(Multiple Choice)
4.8/5 (41)
Construct the requested histogram.
-The number of days off that 30 police officers took in a given year are provided below. Create a histogram of the data using bins 2 days wide.
10 1 3 5 4 7 5 1 0 9 11 1 5 4 1 7 7 11 0 6 6 1 5 7 10 1 1 5 6 0
(Essay)
4.9/5 (36)
Provide an appropriate response.
-The frequency table shows the number of days of vacation taken in 1996 by 100 employees of a company.
Days of vacation Frequency 0-1 13 2-3 19 4-5 21 6-7 14 8-9 33
Create a cumulative frequency table for the data.
(Multiple Choice)
4.9/5 (40)
A machine is supposed to fill juice bottles with 16 fluid ounces of juice. The manufacturer picks a sample of bottles which have been filled by the machine and determines the volume of juice in each bottle. The results are shown in the stem-and-leaf diagram below. The leaf unit is 0.1. 15 1 15 3 15 45 15 667777 15 888899999 16 00000011111 16 222223333 16 445 16 66 16 8
What is the smallest volume of juice (in fluid ounces)measured for the bottles sampled?
(Multiple Choice)
4.7/5 (37)
Filters
- Essay(0)
- Multiple Choice(0)
- Short Answer(0)
- True False(0)
- Matching(0)