Exam 14: Introduction to Multiple
Exam 1: Defining and Collecting Data200 Questions
Exam 2: Organizing and Visualizing189 Questions
Exam 3: Numerical Descriptive Measures80 Questions
Exam 4: Basic Probability108 Questions
Exam 5: Discrete Probability Distributions81 Questions
Exam 6: Conthe Tinuonormausl Disdis Tributionstribution and Other38 Questions
Exam 7: Sampling Distributions62 Questions
Exam 8: Confidence Interval Estimation139 Questions
Exam 9: Fundamentals of Hypothesis Testing: One-Sample Tests133 Questions
Exam 10: Two-Sample Tests95 Questions
Exam 11: Analysis of Variance73 Questions
Exam 12: Chi-Square and Nonparametric100 Questions
Exam 13: Simple Linear Regression89 Questions
Exam 14: Introduction to Multiple113 Questions
Exam 15: Multiple Regression62 Questions
Exam 16: Time-Series Forecasting61 Questions
Exam 17: Business Analytics102 Questions
Exam 18: A Roadmap for Analyzing Data133 Questions
Exam 19: Statistical Applications in Quality Management86 Questions
Exam 20: Decision Making121 Questions
Select questions type
True or False: From the coefficient of multiple determination, you cannot detect the strength
of the relationship between Y and any individual independent variable.
(True/False)
4.9/5  (33)
(33)
True or False: The coefficient of multiple determination measures the proportion of the total
variation in the dependent variable that is explained by the set of independent variables.
(True/False)
4.8/5 (25)
SCENARIO 14-15 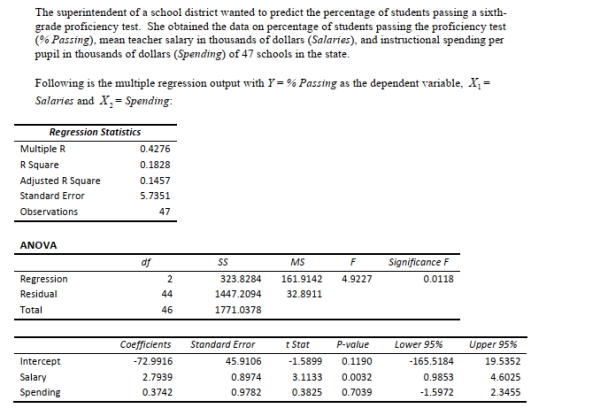 -True or False: Referring to Scenario 14-15, you can conclude definitively that mean teacher
salary individually has no impact on the mean percentage of students passing the proficiency test,
taking into account the effect of that instructional spending per pupil, at a 10% level of
significance based solely on but not actually computing the 90% confidence interval estimate for
β1.
-True or False: Referring to Scenario 14-15, you can conclude definitively that mean teacher
salary individually has no impact on the mean percentage of students passing the proficiency test,
taking into account the effect of that instructional spending per pupil, at a 10% level of
significance based solely on but not actually computing the 90% confidence interval estimate for
β1.
(True/False)
4.9/5 (32)
True or False: Consider a regression in which b2 = - 1.5 and the standard error of this
coefficient equals 0.3.To determine whether X2 is a significant explanatory variable, you would
compute an observed t-value of - 5.0.
(True/False)
4.9/5 (36)
SCENARIO 14-3 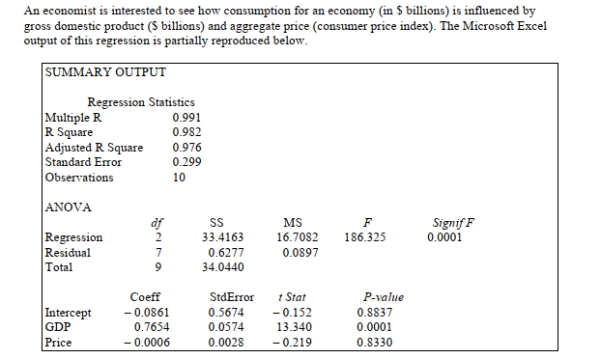 -Referring to Scenario 14-3, what is the estimated mean consumption level for an economy with
GDP equal to $4 billion and an aggregate price index of 150?
-Referring to Scenario 14-3, what is the estimated mean consumption level for an economy with
GDP equal to $4 billion and an aggregate price index of 150?
(Multiple Choice)
4.8/5 (36)
SCENARIO 14-5
A microeconomist wants to determine how corporate sales are influenced by capital and wage
spending by companies.She proceeds to randomly select 26 large corporations and record
information in millions of dollars.The Microsoft Excel output below shows results of this multiple
regression. 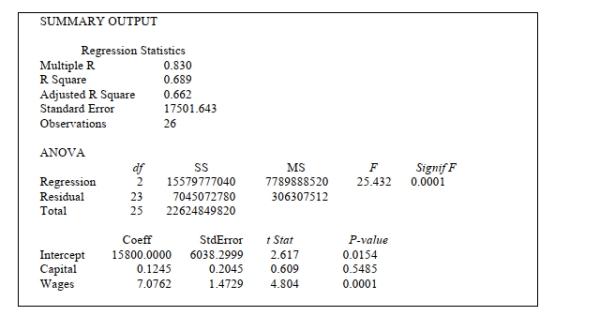 Introduction to Multiple Regression 14-17
-Referring to Scenario 14-5, suppose the microeconomist wants to test whether the coefficient on
Capital is significantly different from 0.What is the value of the relevant t-statistic?
Introduction to Multiple Regression 14-17
-Referring to Scenario 14-5, suppose the microeconomist wants to test whether the coefficient on
Capital is significantly different from 0.What is the value of the relevant t-statistic?
(Multiple Choice)
4.8/5 (25)
SCENARIO 14-1 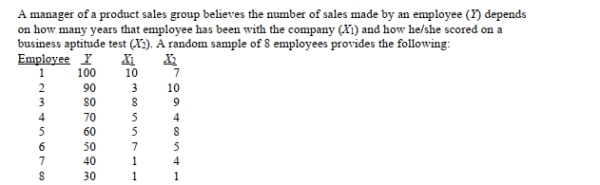 -Referring to Scenario 14-1, for these data, what is the estimated coefficient for the variable
Representing years an employee has been with the company, b1?
-Referring to Scenario 14-1, for these data, what is the estimated coefficient for the variable
Representing years an employee has been with the company, b1?
(Multiple Choice)
4.9/5 (31)
True or False: When an explanatory variable is dropped from a multiple regression model, the
adjusted r2 can increase.
(True/False)
4.9/5 (46)
SCENARIO 14-14
An automotive engineer would like to be able to predict automobile mileages.She believes that the
two most important characteristics that affect mileage are horsepower and the number of cylinders (4
or 6)of a car.She believes that the appropriate model is
Y = 40 - 0.05X1 + 20X2 - 0.1X1X2
where X1 = horsepower
X2 = 1 if 4 cylinders, 0 if 6 cylinders
Y = mileage.
-Referring to Scenario 14-14, the predicted mileage for a 200 horsepower, 4-cylinder car is
________.
(Essay)
4.8/5 (38)
SCENARIO 14-5
A microeconomist wants to determine how corporate sales are influenced by capital and wage
spending by companies.She proceeds to randomly select 26 large corporations and record
information in millions of dollars.The Microsoft Excel output below shows results of this multiple
regression.
Introduction to Multiple Regression 14-17
-Referring to Scenario 14-5, at the 0.01 level of significance, what conclusion should the
Microeconomist reach regarding the inclusion of Capital in the regression model?
(Multiple Choice)
4.9/5 (28)
The variation attributable to factors other than the relationship between the independent variables
And the explained variable in a regression analysis is represented by
(Multiple Choice)
4.8/5 (34)
SCENARIO 14-3
-Referring to Scenario 14-3, the p-value for the regression model as a whole is
(Multiple Choice)
4.9/5 (31)
SCENARIO 14-3
-Referring to Scenario 14-3, the p-value for the aggregated price index is
(Multiple Choice)
4.8/5 (36)
True or False: A multiple regression is called "multiple" because it has several data points.
(True/False)
4.8/5 (33)
SCENARIO 14-5
A microeconomist wants to determine how corporate sales are influenced by capital and wage
spending by companies.She proceeds to randomly select 26 large corporations and record
information in millions of dollars.The Microsoft Excel output below shows results of this multiple
regression.
Introduction to Multiple Regression 14-17
-Referring to Scenario 14-5, what is the p-value for testing whether Wages have a negative impact
On corporate sales?
(Multiple Choice)
4.8/5 (31)
SCENARIO 14-15
-True or False: Referring to Scenario 14-15, the null hypothesis should be rejected at a 5% level
of significance when testing whether there is a significant relationship between percentage of
students passing the proficiency test and the entire set of explanatory variables.
(True/False)
4.8/5 (41)
SCENARIO 14-4 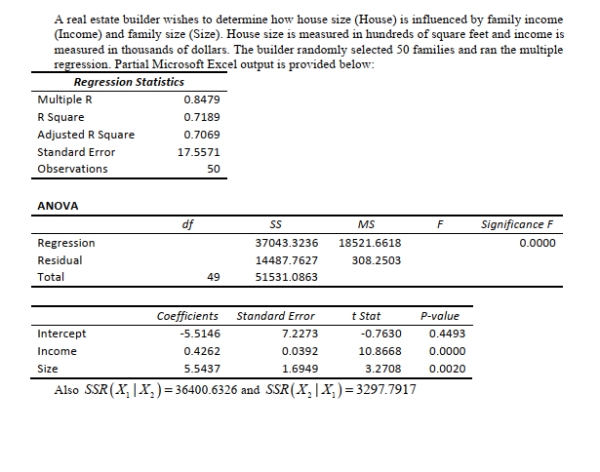 14-10 Introduction to Multiple Regression
-Referring to Scenario 14-4, suppose the builder wants to test whether the coefficient on Size is
Significantly different from 0.What is the value of the relevant t-statistic?
14-10 Introduction to Multiple Regression
-Referring to Scenario 14-4, suppose the builder wants to test whether the coefficient on Size is
Significantly different from 0.What is the value of the relevant t-statistic?
(Multiple Choice)
4.8/5 (32)
SCENARIO 14-3
-Referring to Scenario 14-3, when the economist used a simple linear regression model with
Consumption as the dependent variable and GDP as the independent variable, he obtained an  Value of 0.971.What additional percentage of the total variation of consumption has been
Explained by including aggregate prices in the multiple regression?
Value of 0.971.What additional percentage of the total variation of consumption has been
Explained by including aggregate prices in the multiple regression?
(Multiple Choice)
5.0/5 (31)
True or False: When an additional explanatory variable is introduced into a multiple regression
model, the coefficient of multiple determination will never decrease.
(True/False)
4.9/5 (41)
Filters
- Essay(0)
- Multiple Choice(0)
- Short Answer(0)
- True False(0)
- Matching(0)