Exam 14: Introduction to Multiple
Exam 1: Defining and Collecting Data200 Questions
Exam 2: Organizing and Visualizing189 Questions
Exam 3: Numerical Descriptive Measures80 Questions
Exam 4: Basic Probability108 Questions
Exam 5: Discrete Probability Distributions81 Questions
Exam 6: Conthe Tinuonormausl Disdis Tributionstribution and Other38 Questions
Exam 7: Sampling Distributions62 Questions
Exam 8: Confidence Interval Estimation139 Questions
Exam 9: Fundamentals of Hypothesis Testing: One-Sample Tests133 Questions
Exam 10: Two-Sample Tests95 Questions
Exam 11: Analysis of Variance73 Questions
Exam 12: Chi-Square and Nonparametric100 Questions
Exam 13: Simple Linear Regression89 Questions
Exam 14: Introduction to Multiple113 Questions
Exam 15: Multiple Regression62 Questions
Exam 16: Time-Series Forecasting61 Questions
Exam 17: Business Analytics102 Questions
Exam 18: A Roadmap for Analyzing Data133 Questions
Exam 19: Statistical Applications in Quality Management86 Questions
Exam 20: Decision Making121 Questions
Select questions type
SCENARIO 14-5
A microeconomist wants to determine how corporate sales are influenced by capital and wage
spending by companies.She proceeds to randomly select 26 large corporations and record
information in millions of dollars.The Microsoft Excel output below shows results of this multiple
regression. 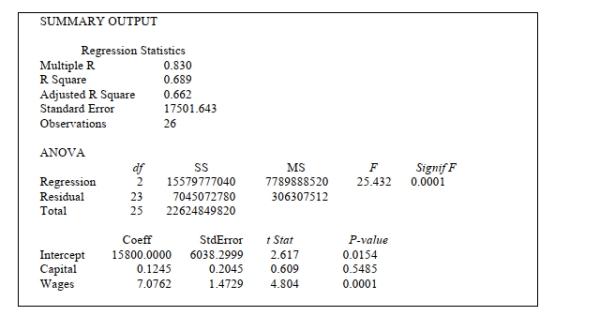 Introduction to Multiple Regression 14-17
-Referring to Scenario 14-5, what is the p-value for Capital?
Introduction to Multiple Regression 14-17
-Referring to Scenario 14-5, what is the p-value for Capital?
(Multiple Choice)
4.8/5  (37)
(37)
SCENARIO 14-15 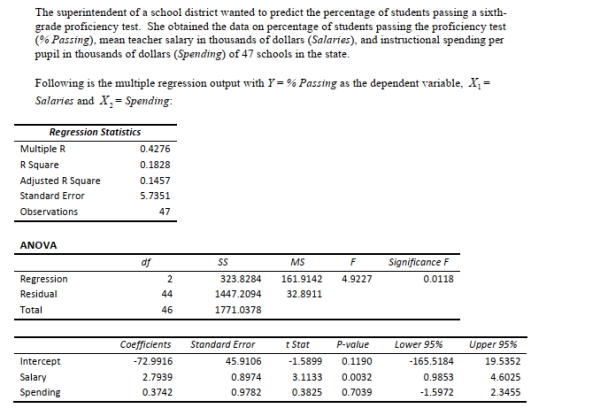 -True or False: Referring to Scenario 14-15, there is sufficient evidence that at least one of the
explanatory variables is related to the percentage of students passing the proficiency test at a 5%
level of significance.
-True or False: Referring to Scenario 14-15, there is sufficient evidence that at least one of the
explanatory variables is related to the percentage of students passing the proficiency test at a 5%
level of significance.
(True/False)
4.8/5 (34)
SCENARIO 14-4 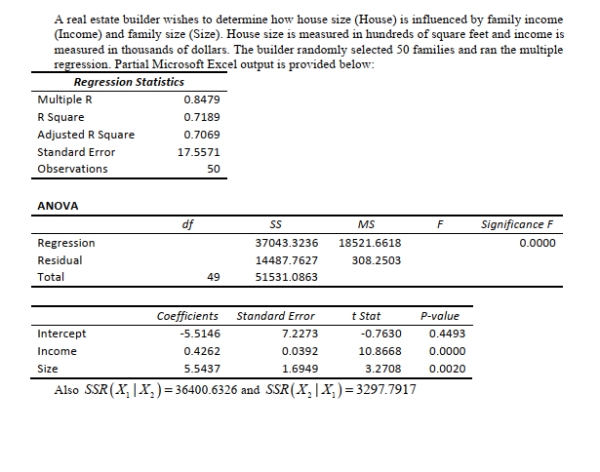 14-10 Introduction to Multiple Regression
-Referring to Scenario 14-4, when the builder used a simple linear regression model with house
Size (House)as the dependent variable and family size (Size)as the independent variable, he
Obtained an r2 value of 1.25%.What additional percentage of the total variation in house size has
Been explained by including income in the multiple regression?
14-10 Introduction to Multiple Regression
-Referring to Scenario 14-4, when the builder used a simple linear regression model with house
Size (House)as the dependent variable and family size (Size)as the independent variable, he
Obtained an r2 value of 1.25%.What additional percentage of the total variation in house size has
Been explained by including income in the multiple regression?
(Multiple Choice)
4.8/5 (48)
SCENARIO 14-3 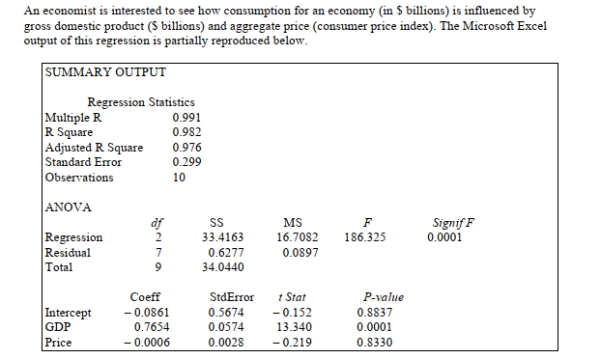 -Referring to Scenario 14-3, to test whether aggregate price index has a negative impact on
Consumption, the p-value is _______?
-Referring to Scenario 14-3, to test whether aggregate price index has a negative impact on
Consumption, the p-value is _______?
(Multiple Choice)
4.8/5 (39)
SCENARIO 14-13
An econometrician is interested in evaluating the relationship of demand for building materials to
mortgage rates in Los Angeles and San Francisco.He believes that the appropriate model is
Y = 10 + 5X1 + 8X2
where X1 = mortgage rate in %
X2 = 1 if SF, 0 if LA
Y = demand in $100 per capita
-Referring to Scenario 14-13, the fitted model for predicting demand in San Francisco is
________.
(Multiple Choice)
4.8/5 (42)
SCENARIO 14-16 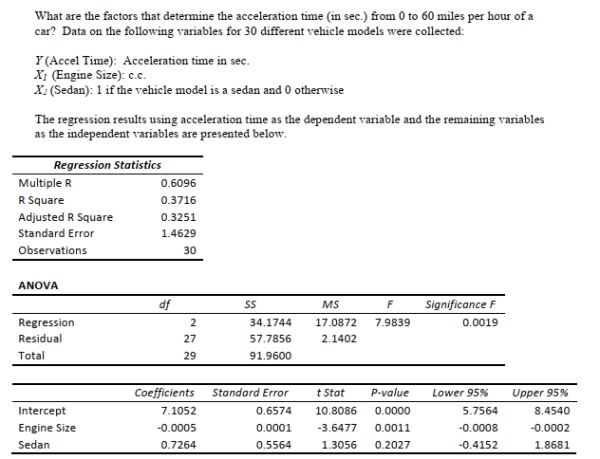
 14-64 Introduction to Multiple Regression
  Introduction to Multiple Regression 14-65
  -True or False: Referring to Scenario 14-16, the 0 to 60 miles per hour acceleration time of a
sedan is predicted to be 0.0005 seconds higher than that of a non-sedan with the same engine size.
-True or False: Referring to Scenario 14-16, the 0 to 60 miles per hour acceleration time of a
sedan is predicted to be 0.0005 seconds higher than that of a non-sedan with the same engine size.
(True/False)
4.9/5 (38)
SCENARIO 14-2 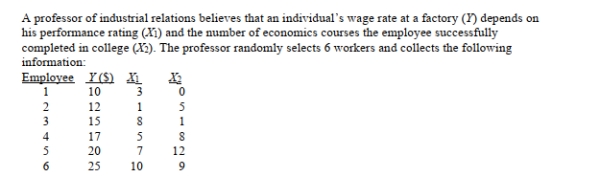 -Referring to Scenario 14-2, suppose an employee had never taken an economics course and
Managed to score a 5 on his performance rating.What is his estimated expected wage rate?
-Referring to Scenario 14-2, suppose an employee had never taken an economics course and
Managed to score a 5 on his performance rating.What is his estimated expected wage rate?
(Multiple Choice)
4.8/5 (37)
SCENARIO 14-3
-Referring to Scenario 14-3, the p-value for GDP is
(Multiple Choice)
4.9/5 (36)
True or False: A regression had the following results: SST = 82.55, SSE = 29.85.It can be said
that 63.84% of the variation in the dependent variable is explained by the independent variables
in the regression.
(True/False)
4.8/5 (30)
SCENARIO 14-4
14-10 Introduction to Multiple Regression
-Referring to Scenario 14-4, which of the following values for the level of significance is the
Smallest for which at most one explanatory variable is significant individually?
(Multiple Choice)
4.8/5 (42)
SCENARIO 14-1  -Referring to Scenario 14-1, for these data, what is the value for the regression constant, b0?
(Multiple Choice)
4.9/5 (38)
SCENARIO 14-15
-Referring to Scenario 14-15, the null hypothesis H01:0β ==β2 implies that percentage of
students passing the proficiency test is not affected by either of the explanatory variables.
(True/False)
4.9/5 (41)
SCENARIO 14-15
-Referring to Scenario 14-15, what are the lower and upper limits of the 95% confidence
interval estimate for the effect of a one thousand dollars increase in instructional spending per
pupil on the mean percentage of students passing the proficiency test?
(Essay)
4.8/5 (28)
Filters
- Essay(0)
- Multiple Choice(0)
- Short Answer(0)
- True False(0)
- Matching(0)