Exam 11: Analysis of Variance
Exam 1: Defining and Collecting Data200 Questions
Exam 2: Organizing and Visualizing189 Questions
Exam 3: Numerical Descriptive Measures80 Questions
Exam 4: Basic Probability108 Questions
Exam 5: Discrete Probability Distributions81 Questions
Exam 6: Conthe Tinuonormausl Disdis Tributionstribution and Other38 Questions
Exam 7: Sampling Distributions62 Questions
Exam 8: Confidence Interval Estimation139 Questions
Exam 9: Fundamentals of Hypothesis Testing: One-Sample Tests133 Questions
Exam 10: Two-Sample Tests95 Questions
Exam 11: Analysis of Variance73 Questions
Exam 12: Chi-Square and Nonparametric100 Questions
Exam 13: Simple Linear Regression89 Questions
Exam 14: Introduction to Multiple113 Questions
Exam 15: Multiple Regression62 Questions
Exam 16: Time-Series Forecasting61 Questions
Exam 17: Business Analytics102 Questions
Exam 18: A Roadmap for Analyzing Data133 Questions
Exam 19: Statistical Applications in Quality Management86 Questions
Exam 20: Decision Making121 Questions
Select questions type
SCENARIO 11-11
A physician and president of a Tampa Health Maintenance Organization (HMO)are attempting to
show the benefits of managed health care to an insurance company.The physician believes that
certain types of doctors are more cost-effective than others.One theory is that Primary Specialty is an
important factor in measuring the cost-effectiveness of physicians.To investigate this, the president
obtained independent random samples of 20 HMO physicians from each of 4 primary specialties -
General Practice (GP), Internal Medicine (IM), Pediatrics (PED), and Family Physicians (FP)- and
recorded the total charges per member per month for each.A second factor which the president
believes influences total charges per member per month is whether the doctor is a foreign or USA
medical school graduate.The president theorizes that foreign graduates will have higher mean
charges than USA graduates.To investigate this, the president also collected data on 20 foreign
medical school graduates in each of the 4 primary specialty types described above.So information on
charges for 40 doctors (20 foreign and 20 USA medical school graduates)was obtained for each of
the 4 specialties.The results for the ANOVA are summarized in the following table. 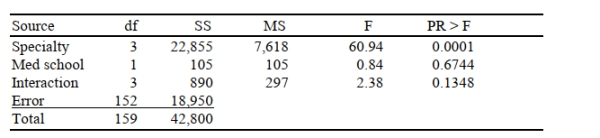 -Referring to Scenario 11-11, what degrees of freedom should be used to determine the critical
Value of the F ratio against which to test for differences between the mean charges of foreign and
USA medical school graduates?
-Referring to Scenario 11-11, what degrees of freedom should be used to determine the critical
Value of the F ratio against which to test for differences between the mean charges of foreign and
USA medical school graduates? 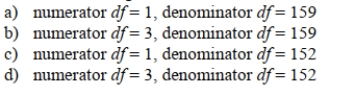
(Multiple Choice)
4.9/5  (49)
(49)
SCENARIO 11-2
A realtor wants to compare the mean sales-to-appraisal ratios of residential properties sold in four
neighborhoods (A, B, C, and D).Four properties are randomly selected from each neighborhood and
the ratios recorded for each, as shown below.
A: 1.2, 1.1, 0.9, 0.4 C: 1.0, 1.5, 1.1, 1.3
B: 2.5, 2.1, 1.9, 1.6 D: 0.8, 1.3, 1.1, 0.7
Interpret the results of the analysis summarized in the following table: 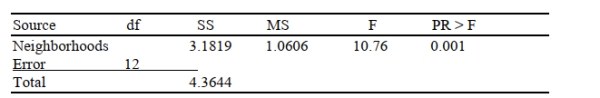 -Referring to Scenario 11-2, the null hypothesis for Levene's test for homogeneity of variances is
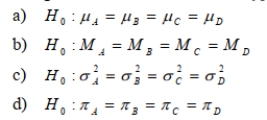
(Multiple Choice)
4.9/5 (38)
SCENARIO 11-3 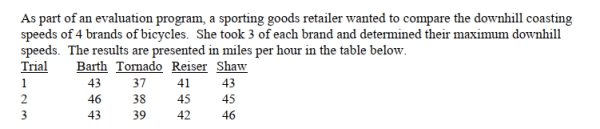 -True or False: Referring to Scenario 11-3, based on the Tukey-Kramer procedure with an overall
level of significance of 0.05, the retailer would decide that there is no significant difference
between any pair of mean speeds.
-True or False: Referring to Scenario 11-3, based on the Tukey-Kramer procedure with an overall
level of significance of 0.05, the retailer would decide that there is no significant difference
between any pair of mean speeds.
(True/False)
4.9/5 (36)
SCENARIO 11-10
A campus researcher wanted to investigate the factors that affect visitor travel time in a complex,
multilevel building on campus.Specifically, he wanted to determine whether different building signs
(building maps versus wall signage)affect the total amount of time visitors require to reach their
destination and whether that time depends on whether the starting location is inside or outside the
building.Three subjects were assigned to each of the combinations of signs and starting locations,
and travel time in seconds from beginning to destination was recorded.An Excel output of the
appropriate analysis is given below: 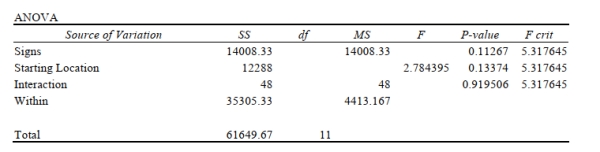 -Referring to Scenario 11-10, the F test statistic for testing the main effect of types of signs is
(Multiple Choice)
4.9/5 (31)
SCENARIO 11-2
A realtor wants to compare the mean sales-to-appraisal ratios of residential properties sold in four
neighborhoods (A, B, C, and D).Four properties are randomly selected from each neighborhood and
the ratios recorded for each, as shown below.
A: 1.2, 1.1, 0.9, 0.4 C: 1.0, 1.5, 1.1, 1.3
B: 2.5, 2.1, 1.9, 1.6 D: 0.8, 1.3, 1.1, 0.7
Interpret the results of the analysis summarized in the following table:
-Referring to Scenario 11-2, the within group sum of squares is
(Multiple Choice)
4.8/5 (37)
SCENARIO 11-3
-True or False: Referring to Scenario 11-3, based on the Tukey-Kramer procedure with an overall
level of significance of 0.05, the retailer would decide that the mean speed for the Tornado brand
is significantly different from each of the mean speeds for other brands.
(True/False)
4.8/5 (37)
SCENARIO 11-2
A realtor wants to compare the mean sales-to-appraisal ratios of residential properties sold in four
neighborhoods (A, B, C, and D).Four properties are randomly selected from each neighborhood and
the ratios recorded for each, as shown below.
A: 1.2, 1.1, 0.9, 0.4 C: 1.0, 1.5, 1.1, 1.3
B: 2.5, 2.1, 1.9, 1.6 D: 0.8, 1.3, 1.1, 0.7
Interpret the results of the analysis summarized in the following table:
-Referring to Scenario 11-2,
(Multiple Choice)
4.8/5 (35)
SCENARIO 11-10
A campus researcher wanted to investigate the factors that affect visitor travel time in a complex,
multilevel building on campus.Specifically, he wanted to determine whether different building signs
(building maps versus wall signage)affect the total amount of time visitors require to reach their
destination and whether that time depends on whether the starting location is inside or outside the
building.Three subjects were assigned to each of the combinations of signs and starting locations,
and travel time in seconds from beginning to destination was recorded.An Excel output of the
appropriate analysis is given below:
-Referring to Scenario 11-10, the F test statistic for testing the interaction effect between the
Types of signs and the starting location is
(Multiple Choice)
4.8/5 (32)
An airline wants to select a computer software package for its reservation system.Four software
Packages (1, 2, 3, and 4)are commercially available.The airline will choose the package that
Bumps the fewest mean number of passengers as possible during a month.An experiment is set
Up in which each package is used to make reservations for 5 randomly selected weeks.(A total of
20 weeks was included in the experiment.)The number of passengers bumped each week is
Given below.How should the data be analyzed? 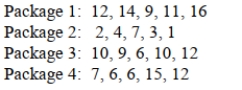
(Multiple Choice)
4.9/5 (35)
True or False: If you are comparing the mean sales among 3 different brands you are dealing
with a three-way ANOVA design.
(True/False)
4.8/5 (31)
SCENARIO 11-4  Analysis of Variance 11-15
-True or False: Referring to Scenario 11-4, the decision made at 0.005 level of significance
implies that all 3 means are significantly different.
Analysis of Variance 11-15
-True or False: Referring to Scenario 11-4, the decision made at 0.005 level of significance
implies that all 3 means are significantly different.
(True/False)
4.8/5 (38)
SCENARIO 11-10
A campus researcher wanted to investigate the factors that affect visitor travel time in a complex,
multilevel building on campus.Specifically, he wanted to determine whether different building signs
(building maps versus wall signage)affect the total amount of time visitors require to reach their
destination and whether that time depends on whether the starting location is inside or outside the
building.Three subjects were assigned to each of the combinations of signs and starting locations,
and travel time in seconds from beginning to destination was recorded.An Excel output of the
appropriate analysis is given below:
-Referring to Scenario 11-10, the within (error)degrees of freedom is
(Multiple Choice)
4.8/5 (37)
SCENARIO 11-1
An airline wants to select a computer software package for its reservation system.Four software
packages (1, 2, 3, and 4)are commercially available.The airline will choose the package that bumps
as few passengers as possible during a month.An experiment is set up in which each package is used
to make reservations for 5 randomly selected weeks.(A total of 20 weeks was included in the
experiment.)The number of passengers bumped each week is obtained, which gives rise to the
following Excel output: 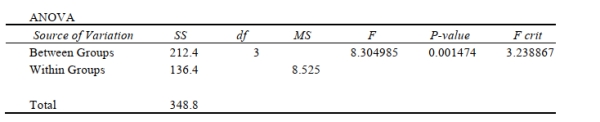 -Referring to Scenario 11-1, at a significance level of 1%,
(Multiple Choice)
4.9/5 (45)
Which of the following components in an ANOVA table are not additive?
(Multiple Choice)
4.9/5 (36)
SCENARIO 11-4
Analysis of Variance 11-15
-Referring to Scenario 11-4, state the null hypothesis that can be tested.
(Essay)
4.9/5 (35)
SCENARIO 11-5 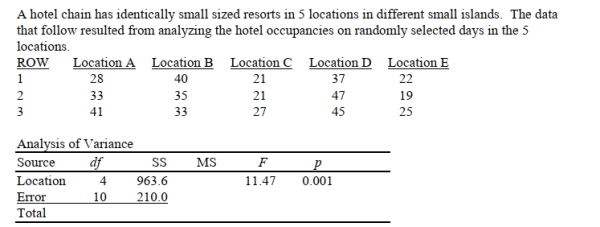 -True or False: Referring to Scenario 11-5, if a level of significance of 0.05 is chosen, the
decision made indicates that all 5 locations have different mean occupancy rates.
-True or False: Referring to Scenario 11-5, if a level of significance of 0.05 is chosen, the
decision made indicates that all 5 locations have different mean occupancy rates.
(True/False)
4.8/5 (37)
SCENARIO 11-9
Psychologists have found that people are generally reluctant to transmit bad news to their peers.This
phenomenon has been termed the "MUM effect." To investigate the cause of the MUM effect, 40
undergraduates at Duke University participated in an experiment.Each subject was asked to
administer an IQ test to another student and then provide the test taker with his or her percentile
score.Unknown to the subject, the test taker was a bogus student who was working with the
researchers.The experimenters manipulated two factors: subject visibility and success of test taker,
each at two levels.Subject visibility was either visible or not visible to the test taker.Success of the
test taker was either top 20% or bottom 20%.Ten subjects were randomly assigned to each of the 2
x 2 = 4 experimental conditions, then the time (in seconds)between the end of the test and the
delivery of the percentile score from the subject to the test taker was measured.(This variable is
called the latency to feedback.)The data were subjected to appropriate analyses with the following
results. 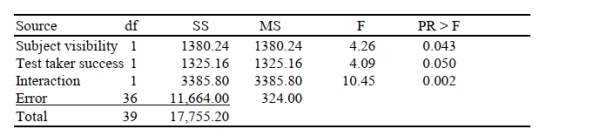 -Referring to Scenario 11-9, in the context of this study, interpret the statement: "Subject
Visibility and test taker success interact."
-Referring to Scenario 11-9, in the context of this study, interpret the statement: "Subject
Visibility and test taker success interact."
(Multiple Choice)
4.8/5 (37)
SCENARIO 11-5
-True or False: Referring to Scenario 11-5, if a level of significance of 0.05 is chosen, the
decision made indicates that at least 2 of the 5 locations have different mean occupancy rates.
(True/False)
4.7/5 (35)
Filters
- Essay(0)
- Multiple Choice(0)
- Short Answer(0)
- True False(0)
- Matching(0)