Exam 3: Numerical Descriptive Measures
Exam 1: Defining and Collecting Data200 Questions
Exam 2: Organizing and Visualizing189 Questions
Exam 3: Numerical Descriptive Measures80 Questions
Exam 4: Basic Probability108 Questions
Exam 5: Discrete Probability Distributions81 Questions
Exam 6: Conthe Tinuonormausl Disdis Tributionstribution and Other38 Questions
Exam 7: Sampling Distributions62 Questions
Exam 8: Confidence Interval Estimation139 Questions
Exam 9: Fundamentals of Hypothesis Testing: One-Sample Tests133 Questions
Exam 10: Two-Sample Tests95 Questions
Exam 11: Analysis of Variance73 Questions
Exam 12: Chi-Square and Nonparametric100 Questions
Exam 13: Simple Linear Regression89 Questions
Exam 14: Introduction to Multiple113 Questions
Exam 15: Multiple Regression62 Questions
Exam 16: Time-Series Forecasting61 Questions
Exam 17: Business Analytics102 Questions
Exam 18: A Roadmap for Analyzing Data133 Questions
Exam 19: Statistical Applications in Quality Management86 Questions
Exam 20: Decision Making121 Questions
Select questions type
In right-skewed distributions, which of the following is the correct statement? 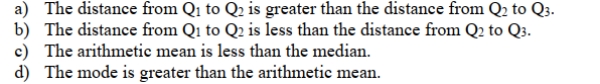
(Multiple Choice)
4.7/5  (31)
(31)
A manufacturer of flashlight batteries took a sample of 130 batteries from a day's production and
Used them continuously until they were drained.The number of hours until failure are recorded.
Given below is the boxplot of the number of hours it took to drain each of the 130 batteries.The
Distribution of the number of hours is 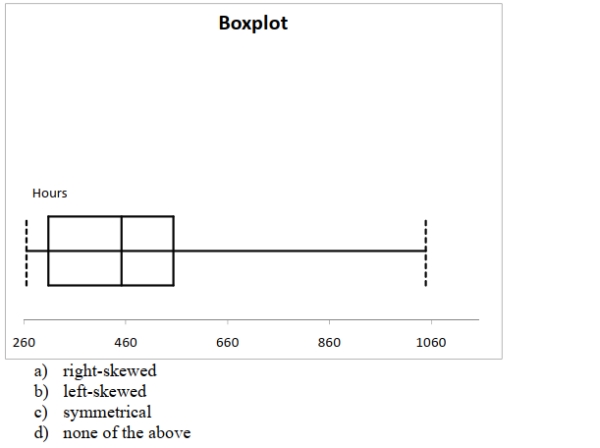
(Multiple Choice)
4.8/5 (36)
SCENARIO 3-3
The ordered array below represents the number of vitamin supplements sold by a health food store in
a sample of 16 days.  Note: For this sample, the sum of the values is 448, and the sum of the squared differences between
each value and the mean is 812.
-Referring to Scenario 3-3, the range of the number of vitamin supplements sold in this sample is
________.
Note: For this sample, the sum of the values is 448, and the sum of the squared differences between
each value and the mean is 812.
-Referring to Scenario 3-3, the range of the number of vitamin supplements sold in this sample is
________.
(Essay)
5.0/5 (33)
True or False: The interquartile range is a measure of central tendency in a set of data.
(True/False)
4.8/5 (32)
SCENARIO 3-2
The data below represent the amount of grams of carbohydrates in a serving of breakfast cereal in a
sample of 11 different servings.  -Referring to Scenario 3-2, the kurtosis statistic for the carbohydrate amount in the cereal is
________.
-Referring to Scenario 3-2, the kurtosis statistic for the carbohydrate amount in the cereal is
________.
(Essay)
4.7/5 (39)
SCENARIO 3-1
Health care issues are receiving much attention in both academic and political arenas.A sociologist
recently conducted a survey of citizens over 60 years of age whose net worth is too high to qualify for
Medicaid.The ages of 25 senior citizens were as follows:  -Referring to Scenario 3-1, what type of shape does the distribution of the sample appear to have?
(Essay)
4.7/5 (38)
True or False: In a set of numerical data, the value for Q3 can never be smaller than the value for
Q1.
(True/False)
4.9/5 (46)
SCENARIO 3-3
The ordered array below represents the number of vitamin supplements sold by a health food store in
a sample of 16 days. Note: For this sample, the sum of the values is 448, and the sum of the squared differences between
each value and the mean is 812.
-Referring to Scenario 3-3, construct a boxplot for the data in this sample.
(Essay)
4.9/5 (47)
True or False: In a set of numerical data, the value for Q2 is always halfway between Q1 and Q3.
(True/False)
4.8/5 (39)
SCENARIO 3-1
Health care issues are receiving much attention in both academic and political arenas.A sociologist
recently conducted a survey of citizens over 60 years of age whose net worth is too high to qualify for
Medicaid.The ages of 25 senior citizens were as follows:
-Referring to Scenario 3-1, identify which of the following is the correct statement.
(Multiple Choice)
4.7/5 (43)
True or False: The interquartile range is a measure of variation or dispersion in a set of data.
(True/False)
5.0/5 (46)
In a perfectly symmetrical bell-shaped "normal" distribution
(Multiple Choice)
4.9/5 (26)
According to the Chebyshev rule, at least 75% of all observations in any data set are contained
Within a distance of how many standard deviations around the mean?
(Multiple Choice)
4.8/5 (32)
SCENARIO 3-2
The data below represent the amount of grams of carbohydrates in a serving of breakfast cereal in a
sample of 11 different servings.
-Referring to Scenario 3-2, the third quartile of the carbohydrate amounts is ________ grams.
(Essay)
4.8/5 (32)
SCENARIO 3-3
The ordered array below represents the number of vitamin supplements sold by a health food store in
a sample of 16 days. Note: For this sample, the sum of the values is 448, and the sum of the squared differences between
each value and the mean is 812.
-Referring to Scenario 3-3, what type of shape does the distribution of the sample appear to have?
(Essay)
4.8/5 (30)
SCENARIO 3-2
The data below represent the amount of grams of carbohydrates in a serving of breakfast cereal in a
sample of 11 different servings.
-Referring to Scenario 3-2, the median carbohydrate amount in the cereal is ________ grams.
(Essay)
4.8/5 (41)
If the arithmetic mean of a numerical data set is greater than the median, the data are considered
to be _______ skewed.
(Essay)
4.9/5 (34)
SCENARIO 3-3
The ordered array below represents the number of vitamin supplements sold by a health food store in
a sample of 16 days. Note: For this sample, the sum of the values is 448, and the sum of the squared differences between
each value and the mean is 812.
-Referring to Scenario 3-3, the kurtosis statitic of the number of vitamin supplements sold in this
sample is ________.
(Essay)
4.8/5 (38)
According to the empirical rule, if the data form a "bell-shaped" normal distribution, _______
Percent of the observations will be contained within 3 standard deviations around the arithmetic
Mean.
(Multiple Choice)
4.8/5 (37)
Filters
- Essay(0)
- Multiple Choice(0)
- Short Answer(0)
- True False(0)
- Matching(0)