Exam 10: Correlation and Regression
Exam 1: Introduction to Statistics106 Questions
Exam 2: Summarizing and Graphing Data85 Questions
Exam 3: Statistics for Describing, Exploring, and Comparing Data187 Questions
Exam 4: Probability186 Questions
Exam 5: Discrete Probability Distributions155 Questions
Exam 6: Normal Probability Distributions227 Questions
Exam 7: Estimates and Sample Size141 Questions
Exam 8: Hypothesis Testing139 Questions
Exam 9: Inferences From Two Samples133 Questions
Exam 10: Correlation and Regression104 Questions
Exam 11: Chi-Square and Analysis of Variance65 Questions
Select questions type
Which of the following statements concerning the linear correlation coefficient are true? I: If the linear correlation coefficient for two variables is zero, then there is no relationship between The variables.
II: If the slope of the regression line is negative, then the linear correlation coefficient is negative.
III: The value of the linear correlation coefficient always lies between -1 and 1.
IV: A linear correlation coefficient of 0.62 suggests a stronger linear relationship than a linear Correlation coefficient of -0.82.
(Multiple Choice)
4.8/5  (31)
(31)
Is the data point, P, an outlier, an influential point, both, or neither?
-The regression equation for a set of paired data is . The values of x run from 100 to 400. A new data point, P(176, 159.1), is added to the set.
(Multiple Choice)
4.8/5 (38)
Use the given data to find the best predicted value of the response variable.
-Six pairs of data yield and the regression equation . Also, . What is the best predicted value of for ?
(Multiple Choice)
4.8/5 (37)
Applicants for a particular job, which involves extensive travel in Spanish speaking countries, must take a proficiency test in Spanish. The sample data below were obtained in a study of the relationship between the numbers of years applicants have studied Spanish (x) and their score on the test (y).
3 4 4 2 5 3 4 5 3 2 57 78 72 58 89 63 73 84 75 48 The regression equation =31.55+10.90x was obtained. Construct a residual plot for the 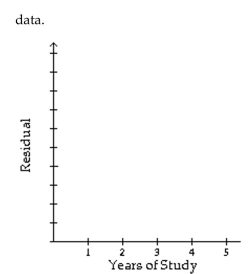
(Essay)
4.7/5 (41)
When performing a rank correlation test, one alternative to using the Critical Values of Spearman's Rank Correlation Coefficient table to find critical values is to compute them using this approximation:
where is the -score from the Distribution table corresponding to degrees of freedom. Use this approximation to find critical values of for the case where and .
(Multiple Choice)
4.7/5 (35)
Find the value of the linear correlation coefficient r.
-Two separate tests are designed to measure a student's ability to solve problems. Several students are randomly selected to take both tests and the results are shown below. Test A 48 52 58 44 43 43 40 51 59 Test B 73 67 73 59 58 56 58 64 74
(Multiple Choice)
4.8/5 (39)
Create a scatterplot that shows a perfect positive correlation between x and y. How would the scatterplot change if the correlation showed a) a strong positive correlation, b) a weak positive correlation, and c) no correlation?
(Essay)
4.8/5 (29)
Nine adults were selected at random from among those working full time in the town of Workington.
Each person was asked the number of years of college education they had completed and was also asked to rate their job satisfaction on a scale of 1 to 10.
The pairs of data values area plotted in the scatterplot below. 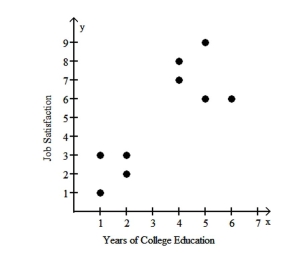 The four points in the lower left corner correspond to employees from company A and the five points in the upper right corner correspond to employees from company B.
a. Using the pairs of values for all 9 points, find the equation of the regression line.
b. Using only the pairs of values for the four points in the lower left corner, find the equation of the regression line.
c. Using only the pairs of values for the five points in the upper right corner, find the equation of the regression line.
d. Compare the results from parts a, b, and c.
The four points in the lower left corner correspond to employees from company A and the five points in the upper right corner correspond to employees from company B.
a. Using the pairs of values for all 9 points, find the equation of the regression line.
b. Using only the pairs of values for the four points in the lower left corner, find the equation of the regression line.
c. Using only the pairs of values for the five points in the upper right corner, find the equation of the regression line.
d. Compare the results from parts a, b, and c.
(Essay)
4.8/5 (42)
Use the given data to find the best predicted value of the response variable.
-Based on the data from six students, the regression equation relating number of hours of preparation and test score is . The same data yield and . What is the best predicted test score for a student who spent 5 hours preparing for the test?
(Multiple Choice)
4.8/5 (35)
Describe the error in the stated conclusion
-Given: Each school in a state reports the average SAT score of its students. There is a significant linear correlation between the average SAT score of a school and the average annual income in the district in which the school is located.
Conclusion: There is a significant linear correlation between individual SAT scores and family income.
(Essay)
4.8/5 (30)
Find the critical value. Assume that the test is two-tailed and that n denotes the number of pairs of data.
-
(Multiple Choice)
4.9/5 (31)
Use the given data to find the equation of the regression line. Round the final values to three significant digits, if necessary.
- 0 3 4 5 12 8 2 6 9 12
(Multiple Choice)
4.8/5 (35)
Use the rank correlation coefficient to test for a correlation between the two variables.
-The scores of twelve students on the midterm exam and the final exam were as follows. Student Midterm Final Navarro 93 91 Reaves 89 85 Hurlburt 71 73 Knuth 65 77 Lengyel 62 67 Mcmeekan 74 79 Bolker 77 65 Ammatto 87 83 Pothakos 82 89 Sul1 ivan 81 71 Hahl 91 81 Zurfiuh 83 94
Find the rank correlation coefficient and test the claim of correlation between midterm score and final exam score. Use a significance level of 0.05.
(Essay)
4.8/5 (28)
Suppose you will perform a test to determine whether there is sufficient evidence to support a claim of a linear correlation between two variables. Find the critical values of r given the number of pairs of data n and the significance
level .
-
(Multiple Choice)
4.8/5 (36)
Use the given data to find the best predicted value of the response variable.
-The regression equation relating attitude rating and job performance rating for the employees of a company is . Ten pairs of data were used to obtain the equation. The same data yield and . What is the best predicted job performance rating for a person whose attitude rating is
(Multiple Choice)
4.9/5 (37)
A rank correlation coefficient is to be calculated for a collection of paired data. The values lie between -10 and 10. Which of the following could affect the value of the rank correlation coefficient?
I: Multiplying every value of one variable by 3
II: Interchanging the two variables
III: Adding 2 to each value of one variable
IV: Replacing every value of one variable by its absolute value
(Multiple Choice)
4.8/5 (32)
A regression equation is obtained for a set of data. After examining a scatter diagram, the researcher notices a data point that is potentially an influential point. How could she confirm that this data point is indeed an influential point?
(Essay)
4.9/5 (32)
Suppose there is significant correlation between two variables. Describe two cases under which it might be inappropriate to use the linear regression equation for prediction. Give examples to support these cases.
(Essay)
4.8/5 (34)
Use the given data to find the equation of the regression line. Round the final values to three significant digits, if necessary.
- x 6 8 20 28 36 2 4 13 20 30
(Multiple Choice)
4.7/5 (20)
Filters
- Essay(0)
- Multiple Choice(0)
- Short Answer(0)
- True False(0)
- Matching(0)