Exam 10: Correlation and Regression
Exam 1: Introduction to Statistics106 Questions
Exam 2: Summarizing and Graphing Data85 Questions
Exam 3: Statistics for Describing, Exploring, and Comparing Data187 Questions
Exam 4: Probability186 Questions
Exam 5: Discrete Probability Distributions155 Questions
Exam 6: Normal Probability Distributions227 Questions
Exam 7: Estimates and Sample Size141 Questions
Exam 8: Hypothesis Testing139 Questions
Exam 9: Inferences From Two Samples133 Questions
Exam 10: Correlation and Regression104 Questions
Exam 11: Chi-Square and Analysis of Variance65 Questions
Select questions type
Use the rank correlation coefficient to test for a correlation between the two variables.
-A college administrator collected information on first-semester night-school students. A random sample taken of 12 students yielded the following data on age and GPA during the first semester.
Age GPA 18 1.2 26 3.8 27 2.0 37 3.3 33 2.5 47 1.6 20 1.4 48 3.6 50 3.7 38 3.4 34 2.7 22 2.8
Do the data provide sufficient evidence to conclude that the variables age, , and GPA, , are correlated? Apply a rank-correlation test. Use .
(Essay)
4.7/5  (31)
(31)
For the data below, determine the value of the linear correlation coefficient r between y and ln x and test whether the linear correlation is significant. Use a significance level of0.05.
1.2 2.7 4.4 6.6 9.5 1.6 4.7 8.9 9.5 12.0
(Essay)
4.9/5 (32)
Two different tests are designed to measure employee productivity and dexterity. Several employees are randomly selected and tested with these results.
Productivity 23 25 28 21 21 25 26 30 34 36 Dexterity 49 53 59 42 47 53 55 63 67 75
(Multiple Choice)
4.8/5 (33)
Suppose paired data are collected consisting of, for each person, their weight in pounds and the number of calories burned in 30 minutes of walking on a treadmill at 3.5 mph.
How would the value of the correlation coefficient, r, change if all of the weights were converted to kilograms?
(Essay)
4.9/5 (38)
Describe what scatterplots are and discuss the importance of creating scatterplots.
(Essay)
4.9/5 (40)
A study was conducted to compare the average time spent in the lab each week versus course grade for computer programming students. The results are recorded in the table below. Number of hours spent in lab Grade (percent) 10 96 11 51 16 62 9 58 7 89 15 81 16 46 10 51
(Multiple Choice)
4.7/5 (31)
For which of the following sets of data points can you reasonably determine a regression line? 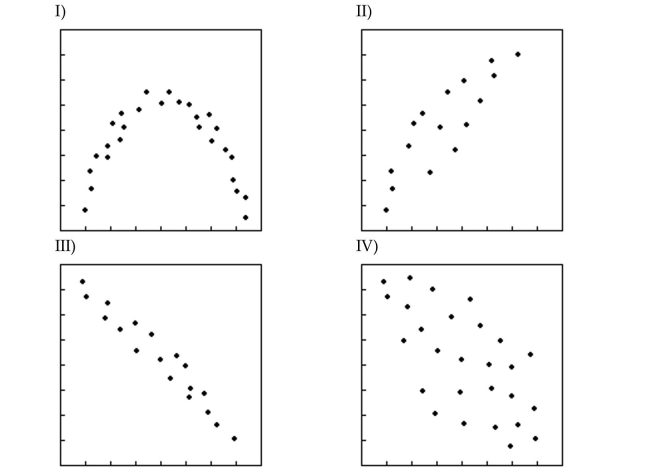
(Multiple Choice)
4.8/5 (33)
For the data below, determine the logarithmic equation, that best fits the data. Hint: Begin by replacing each -value with then use the usual methods to find the equation of the least squares regression line.
1.2 2.7 4.4 6.6 9.5 1.6 4.7 8.9 9.5 12.0
(Multiple Choice)
4.8/5 (30)
What is the relationship between the linear correlation coefficient and the usefulness of the regression equation for making predictions?
(Essay)
4.8/5 (33)
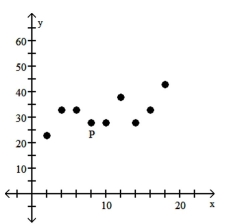
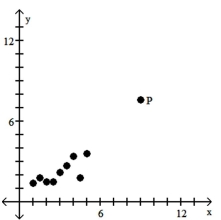
Is the data point, P, an outlier, an influential point, both, or neither?
-
(Multiple Choice)
4.7/5 (33)
Use the given data to find the best predicted value of the response variable.
-Eight pairs of data yield and the regression equation . Also, What is the best predicted value of for
(Multiple Choice)
4.9/5 (43)
Nine pairs of data yield and the regression equation . Also, . What is the best predicted value of for ?
(Multiple Choice)
4.9/5 (40)
Find the value of the linear correlation coefficient r.
- 62 53 64 52 52 54 58 158 176 151 164 164 174 162
(Multiple Choice)
4.8/5 (33)
Use the given data to find the equation of the regression line. Round the final values to three significant digits, if necessary.
- 1.2 1.4 1.6 1.8 2.0 54 53 55 54 56
(Multiple Choice)
4.8/5 (26)
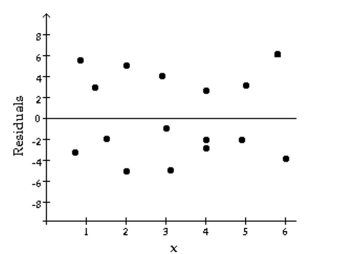
The following residual plot is obtained after a regression equation is determined for a set of data. Does the residual plot suggest that the regression equation is a bad model? Why or why not?
(Essay)
4.9/5 (28)
The following scatterplot shows the percentage of the vote a candidate received in the 2004 senatorial elections according to the voter's income level based on an exit poll of voters conducted by CNN. The income levels 1-8 correspond to the following income classes: Under ; or more.
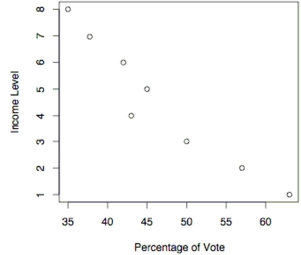 -Use the election scatterplot to determine whether there is a correlation between percentage of vote and income level at the 0.01 significance level with a null hypothesis of
(Multiple Choice)
4.8/5 (33)
The following scatterplot shows the percentage of the vote a candidate received in the 2004 senatorial elections according to the voter's income level based on an exit poll of voters conducted by CNN. The income levels 1-8 correspond to the following income classes: Under ; or more.
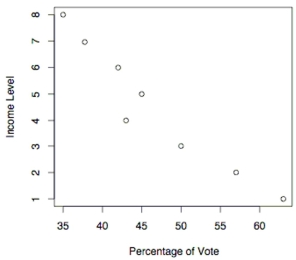 -Use the election scatterplot to the find the critical values corresponding to a significance level used to test the null hypothesis of .
(Multiple Choice)
4.9/5 (38)
Is the data point, P, an outlier, an influential point, both, or neither?
-
(Multiple Choice)
4.8/5 (40)
Ten trucks were ranked according to their comfort levels and their prices.
Make Comfort Price A 1 6 B 6 2 C 2 3 D 8 1 E 4 4 F 7 8 G 9 16 H 1Q 9 J 5
Find the rank correlation coefficient and test the claim of correlation between comfort and price. Use a significance level of 0.05.
(Essay)
4.9/5 (39)
Determine which plot shows the strongest linear correlation.
(Multiple Choice)
4.9/5 (38)
Filters
- Essay(0)
- Multiple Choice(0)
- Short Answer(0)
- True False(0)
- Matching(0)