Exam 13: Inference Without Normality
Exam 1: Introduction to Data60 Questions
Exam 2: Picturing Variation With Graphs60 Questions
Exam 3: Numerical Summaries of Center and Variation60 Questions
Exam 4: Regression Analysis: Exploring Associations Between Variables58 Questions
Exam 5: Modeling Variation With Probability60 Questions
Exam 6: Modeling Random Events: the Normal and Binomial Models60 Questions
Exam 7: Survey Sampling and Inference60 Questions
Exam 8: Hypothesis Testing for Population Proportions60 Questions
Exam 9: Inferring Population Means60 Questions
Exam 10: Associations Between Categorical Variables59 Questions
Exam 11: Multiple Comparisons and Analysis of Variance60 Questions
Exam 12: Experimental Design: Controlling Variation60 Questions
Exam 13: Inference Without Normality60 Questions
Exam 14: Inference for Regression60 Questions
Select questions type
Use the following information to answer the question. Suppose the manager of a large furniture store wants to estimate the
amount spent by customers during the holiday season. She took a random sample of customers and recorded the amount
they spent. A histogram of the data shows that the data is strongly left-skewed. The figures below show the confidence
intervals for the mean amount spent using (A) raw (untransformed) data, and (B) log-transformed data, which showed a
more normally distributed data set. Use this information to answer the question. (A) One-Sample T: Purch Variable Mean StDev SE Mean 95\% CI Purch 17 544.5 140.2 26.0 (472.4,616.6) B) One-Sample T: LogPurch Variable Mean StDev SE Mean 95\% CI LogPurch 17 2.73 0.121 0.101 (2.7,2.8)
-Choose the statement that explains which confidence interval more precisely depicts the data and why.
(Multiple Choice)
4.8/5  (35)
(35)
Use the following information to answer the question. Suppose the manager of a large appliance and electronics store wants to estimate the amount spent by customers during the holiday season. He took a random sample of customers and recorded the amount they spent. A histogram of the data shows that the data is strongly left-skewed. The figures below show the confidence intervals for the mean amount spent using (A) raw (untransformed) data, and (B) log-transformed data, which showed a more normally distributed data set. (A) One-Sample T: Purch Variable Mean StDev SE Mean 95\% CI Purch 20 675.2 350.1 26.0 (511.35,839.05) (B) One-Sample T: LogPurch Variable Mean StDev SE Mean 95\% CI LogPurch 21 2.78 0.246 0.101 (2.67,2.89)
-Calculate the width of both intervals (note that you will need to convert the log-transformed interval back into dollars) and state which interval is narrower?
(Essay)
4.7/5 (38)
Use the following information to answer the question. Can dogs lower anxiety in math class?
Fifty subjects who reported anxiety about attending math class were measured for stress at the beginning of a math class then spent 15 minutes interacting with a dog followed by a forty-five minute math lecture. Each subject was then measured for stress at the end of the lecture. The hypothesis test results for the sign test are summarized below. Assume that all conditions for testing have been met:
Hypothesis test results:
Parameter: Median of variable
: median =0 : median 0
Variable for tests Sample Median Below Equal Above P-value Difference 50 46 1 18 4 28 0.1839
-Using a significance level of 5%, state the correct decision regarding the null hypothesis and write a sentence which summarizes the conclusion and addresses the claim.
(Essay)
4.7/5 (33)
Use the following information to answer the question. Can deep-knee bends help you stay alert in class? Forty subjects were
measured for alertness at the beginning of class then voluntarily performed fifteen deep-knee bends followed by a forty-five
minute lecture. Each subject was then measured for alertness at the end of the lecture. The hypothesis test results for the sign
test are summarized below. Assume that all conditions for testing have been met: Hypothesis test results:
Parameter: Median of variable
: median =0 : median 0
Variable for tests Sample Median Below Equal Above P-value Difference 40 35 1 14 5 21 0.4777
-Using a significance level of 5%, state the correct decision regarding the null hypothesis and concluding statement.
(Multiple Choice)
4.8/5 (44)
Use the following information to answer the question. Suppose the manager of a large furniture store wants to estimate the amount spent by customers during the holiday season. She took a random sample of customers and recorded the amount they spent. A histogram of the data shows that the data is strongly left-skewed. The figures below show the confidence intervals for the mean amount spent using (A) raw (untransformed) data, and (B) log-transformed data, which showed a more normally distributed data set. Use this information to answer the question. (A) One-Sample T: Purch Variable Mean StDev SE Mean 95\% CI Purch 17 544.5 140.2 26.0 (472.4,616.6) B) One-Sample T: LogPurch Variable Mean StDev SE Mean 95\% CI LogPurch 17 2.73 0.121 0.101 (2.7,2.8)
-Calculate the width of both intervals (note that you will need to convert the log-transformed interval back into dollars). Which interval is narrower?
(Multiple Choice)
4.7/5 (35)
Which of the following QQ plots most closely depicts data from a normally distributed population?
(Multiple Choice)
4.9/5 (41)
Which of the following is not necessarily an indication that nonparametric inference might be necessary?
(Multiple Choice)
4.8/5 (42)
Which of the following is an indication that nonparametric inference might be necessary?
(Multiple Choice)
4.8/5 (39)
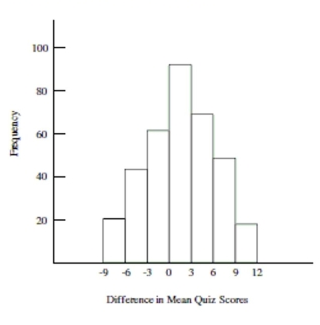
Use the following information to answer the question. Math self-efficacy can be defined as one's belief in his or her own ability to perform mathematical tasks. A college math professor wishes to find out if her male students' math self-efficacy matches reality. To do this she gives a math quiz to the male students then asks them to rate their level of confidence in how well they did on the quiz. She plans to test whether those who had little confidence that they did well on the quiz actually performed worse than those who had a high level of confidence that they did well on the quiz. Shown below is the approximate sampling distribution of the difference in mean quiz scores. The table below shows the summary statistics for the two groups. Assume that all conditions for a randomization test have been satisfied. Group Mean Median Standard Deviation IQR High Conf. 105 82.5 84.0 7.1 12.5 Low Conf. 201 72.1 69.9 6.2 10.4 Test Stat: Mean High Conf. - Mean Low Conf. Number of simulations: 350
 -State the null and alternative hypothesis and also the value of the test statistic for the professor's randomization test.
(Essay)
4.8/5 (41)
A used car lot owner wanted to estimate the amount spent by customers during the summer months. She took a random sample of customers and recorded the amount they spent. A histogram
Showed the data was right-skewed so she took the log of each value and verified that the
Distribution of these values was more Normally distributed. What test/method should she use to
Estimate the mean amount spent during the summer months?
(Multiple Choice)
4.9/5 (36)
Use the following information to answer the question. Suppose the manager of a large appliance and electronics store wants to estimate the amount spent by customers during the holiday season. He took a random sample of customers and recorded the amount they spent. A histogram of the data shows that the data is strongly left-skewed. The figures below show the confidence intervals for the mean amount spent using (A) raw (untransformed) data, and (B) log-transformed data, which showed a more normally distributed data set. (A) One-Sample T: Purch Variable Mean StDev SE Mean 95\% CI Purch 20 675.2 350.1 26.0 (511.35,839.05) (B) One-Sample T: LogPurch Variable Mean StDev SE Mean 95\% CI LogPurch 21 2.78 0.246 0.101 (2.67,2.89)
-Which interval should the manager report to the store owner about the typical amount of money spent during the holiday season?
Explain.
(Essay)
4.8/5 (41)
In the context of nonparametric inference, what information can the QQ provide?
(Multiple Choice)
4.7/5 (33)
In the context of nonparametric inference, what information can the QQ provide?
(Multiple Choice)
4.9/5 (42)
Refer to the following two histograms and QQ plots of the same data to answer the question.  -Match the histogram with the corresponding QQ plot. Histogram (a) goes with QQ plot____
Histogram (b) goes with QQ plot____
-Match the histogram with the corresponding QQ plot. Histogram (a) goes with QQ plot____
Histogram (b) goes with QQ plot____
(Essay)
4.9/5 (41)
Use the following information to answer the question. Can stretching help you stay alert in class? Thirty-six subjects were
measured for alertness at the beginning of class; the subjects then participated in some light arm and neck stretches followed
by a forty-five minute lecture. Each subject was then measured for alertness at the end of the lecture. The hypothesis test
results for the sign test are summarized below. Assume that all conditions for testing have been met: Hypothesis test results:
Parameter: Median of variable
: median =0 : median 0
Variable for tests Sample Median Below Equal Above P-value Difference 36 32 1 12 4 20 0.2153
-What is the name and value of the test statistic?
(Multiple Choice)
4.8/5 (44)
Use the following information to answer the question. Can deep-knee bends help you stay alert in class? Forty subjects were
measured for alertness at the beginning of class then voluntarily performed fifteen deep-knee bends followed by a forty
minute lecture. Each subject was then measured for alertness at the end of the lecture. The hypothesis test results for the sign
test are summarized below. Assume that all conditions for testing have been met: Hypothesis test results:
Parameter: Median of variable
: median =0 : median 0
Variable for tests Sample Median Below Equal Above P-value Difference 40 35 1 14 5 21 0.4777
-What is the name and value of the test statistic?
(Multiple Choice)
4.8/5 (26)
Find the mean, median, and geometric mean for the following numbers: 10, 300, 1500, and 33,000. Round to the nearest tenth.
(Multiple Choice)
4.9/5 (32)
You are presented with data from two independent samples. The variable being measured is continuous. The distribution of the population of each sample is right skewed. You wish to test the
Hypothesis that there is a difference in the median value of the variable for the samples. What type
Test/method should you use?
(Multiple Choice)
4.7/5 (40)
Explain some factors that might indicate that nonparametric inference might be necessary.
(Essay)
4.9/5 (36)
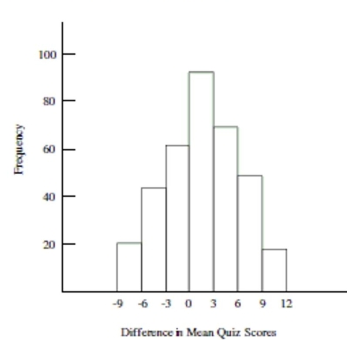
Use the following information to answer the question. Math self-efficacy can be defined as one's belief in his or her own
ability to perform mathematical tasks. A college math professor wishes to find out if her female students' math self-efficacy
matches reality. To do this she gives a math quiz to the female students then asks them to rate their level of confidence in
how well they did on the quiz. She plans to test whether those who had little confidence that they did well on the quiz
actually performed worse than those who had a high level of confidence that they did well on the quiz. Shown below is the
approximate sampling distribution of the difference in mean quiz scores. The table below shows the summary statistics for
the two groups. Assume that all conditions for a randomization test have been satisfied. Group Mean Median Standard Deviation IQR High Conf. 106 77.2 75.5 6.5 10.5 Low Conf. 211 62.2 59.2 5.9 9.3 Test Stat: Mean High Conf. - Mean Low Conf. Number of simulations: 350
 -State the null and alternative hypothesis and also the value of the test statistic for the professor's randomization test.
(Multiple Choice)
4.8/5 (44)
Filters
- Essay(0)
- Multiple Choice(0)
- Short Answer(0)
- True False(0)
- Matching(0)