Exam 14: Inference of the Least-Squares Regression Model and Multiple Regression
Exam 1: Data Collection118 Questions
Exam 2: Creating Tables and Drawing Pictures of Data77 Questions
Exam 3: Numerically Summarizing Data158 Questions
Exam 4: Describing the Relation Between Two Variables183 Questions
Exam 5: Probability266 Questions
Exam 6: Discrete Probability Distributions149 Questions
Exam 7: The Normal Probability Distribution123 Questions
Exam 8: Sampling Distributions46 Questions
Exam 9: Estimating the Value of a Parameter Using Confidence Intervals109 Questions
Exam 10: Hypothesis Tests Regarding a Parameter156 Questions
Exam 11: Inference on Two Samples125 Questions
Exam 12: Inference on Categorical Data39 Questions
Exam 13: Comparing Three or More Means51 Questions
Exam 14: Inference of the Least-Squares Regression Model and Multiple Regression82 Questions
Exam 15: Nonparametric Statistics74 Questions
Select questions type
Conduct Inference on the Slope
-Test the claim, at the level of significance, that a linear relation exists between the two variables, for the data below, given that .
-5 -3 4 1 -1 -2 0 2 3 -4 -10 -8 9 1 -2 -6 -1 3 6 -8
Free
(Essay)
4.8/5  (35)
(35)
Correct Answer: Verified
Since t = 19.510 > t0.005 =3.355, we reject the null hypothesis. There is sufficient evidence to support the claim of a linear relationship between the two variables.
Use Technology to Find a Multiple Regression Equation
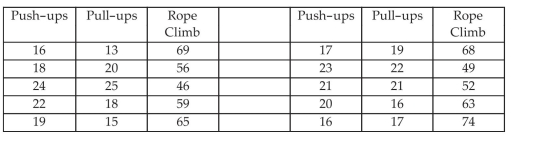
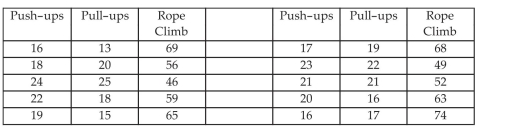
-A gym teacher uses three exercises to increase arm strength: push-ups, pull-ups, and rope climbing. He has 10 students in small class. The exercises consist of doing as many push-ups as possible in 2 minutes. After a rest the student does as many push-ups as possible in 2 minutes. After a rest the student climbs a rope and the time is recorded in seconds. The data for this class is given below. What is the regression equation?
Free
(Multiple Choice)
4.7/5 (40)
Correct Answer:Verified
A
Conduct Inference on the Slope
-A breeder of thoroughbred horses wishes to model the relationship between the gestation period and the length of life of a horse. The breeder believes that the two variables may follow a linear trend. The information in the table was supplied to the breeder from various thoroughbred stables across the state. Test the claim, at the level of significance, that a linear relation exists between the gestation period and the length of life of a horse.
Horse Gestation Life Horse Gestation Life period Length period Length x (days) y (years) x (days) y (years) 1 416 24 5 356 22 2 279 25.5 6 403 23.5 3 298 20 7 265 21 4 307 21.5
Free
(Essay)
4.9/5 (35)
Correct Answer:Verified
Since t = 0.814 < t0.025 = 2.571, we do not reject the null hypothesis. There is not sufficient evidence to support the claim of a linear relationship between the two variables between the gestation period and the length of life of a horse.
Compute the Standard Error of the Estimate
-The data below are the one-way commute times (in minutes) for selected students during a summer class and the number of absences they had for that class for the term. Find the standard error of estimate, se, given that

(Multiple Choice)
4.9/5 (30)
Construct Confidence Intervals for a Mean Response
-A company keeps extensive records on its new salespeople on the premise that sales should increase with experience. A random sample of seven new salespeople produced the data on experience and sales shown in the table. Construct a confidence interval about the mean value of when months.
Months on Job Monthly Sales y (\ thousands) 2 2.4 4 7.0 8 11.3 12 15.0 1 0.8 5 3.7 9 12.0
(Short Answer)
4.9/5 (34)
Interpret the Coefficients of a Multiple Regression Equation
-A minor league baseball team determined the following to be the regression equation for the number of hits a player would get based upon an expected number of times at bat and how many strikeouts they had. The equation is
Hits At Bats Strikeouts.
A new player on the team last year in a different league was at bat 80 times and had 32 strikeouts. How many expected hits would he have had in this league? Round your answer to the next whole hit.
(Multiple Choice)
4.9/5 (35)
Compute the Standard Error of the Estimate
-In linear regression, what is the unbiased estimator of called
(Multiple Choice)
4.8/5 (37)
Construct a Confidence Interval about the Slope of the Least -squares Regression Model
-The data below are the ages and systolic blood pressures (measured in millimeters of mercury) of 9 randomly selected adults.Construct a confidence interval about the slope of the true least-squares regression line, for the data below, given that .
Age, 38 41 45 48 51 53 57 61 65 Pressure 116 120 123 131 142 145 148 150 152
(Multiple Choice)
4.9/5 (38)
Determine R^2 and Adjusted R^2
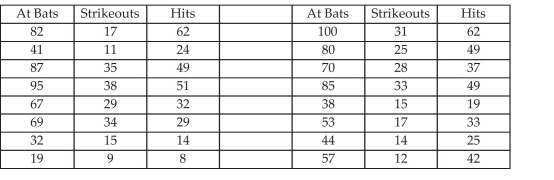
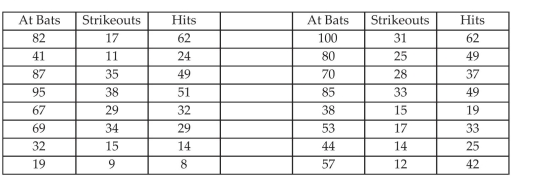
-A minor league baseball team posted the following data for its 16 best players. Determine the adjusted for the multiple regression model where is At Bats, is Strikeouts, and is the response variable "Hits".
(Multiple Choice)
4.8/5 (38)
Test Individual Regression Coefficients for Significance
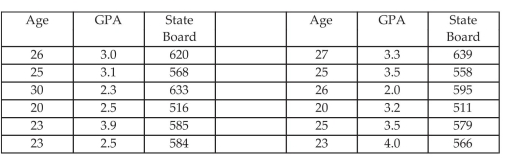
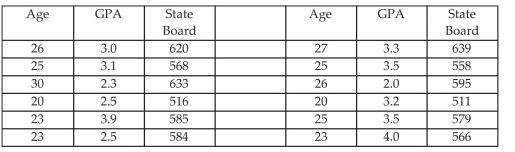
-Twelve nursing students are set to graduate and the registration clerk at the nursing school wonders if there is a correlation between a student's age, their GPA and their state board score. She collects data about the 12 students. The data is given below. Test the significance of the individual predictor variables at .
(Multiple Choice)
4.8/5 (36)
Verify That the Residuals Are Normally Distributed
-For the least-squares regression model, , the predictor variable must be normally distributed. To show that this is true, the________ must also be normal.
(Multiple Choice)
4.9/5 (35)
Compute the Standard Error of the Estimate
-In order for a company's employees to work at a foreign office, they must take a test in the language of the country where they plan to work. The data below shows the relationship between the number of years that employees have studied a particular language and the grades they received on the proficiency exam. Find the standard of estimate, , given that .

(Multiple Choice)
4.9/5 (31)
One of the requirements for conducting inference on the least-squares regression model is that the
(Multiple Choice)
4.9/5 (41)
Obtain the Correlation Matrix
-Twelve nursing students are set to graduate and the registration clerk at the nursing school wonders if there is a correlation between a student's age, their GPA and their state board score. She collects data about the 12 students. The data is given below. What is the correlation between their state board score and their age?
(Multiple Choice)
5.0/5 (36)
Construct Confidence and Prediction Intervals
-A gym teacher uses three exercises to increase arm strength: push-ups, pull-ups, and rope climbing. He has 10 students in small class. The exercises consist of doing as many push-ups as possible in 2 minutes. After a rest the student does as many push-ups as possible in 2 minutes. After a rest the student climbs a rope and the time is recorded in seconds. The data for this class is given below. Construct a confidence interval for the Rope Climb Time if the student's Push-ups are
(Multiple Choice)
4.9/5 (32)
Obtain the Correlation Matrix
-A multiple linear regression model of the form has how many parameters to be estimated?
(Multiple Choice)
4.8/5 (36)
Provide an appropriate response.
-In order for a company's employees to work at a foreign office, they must take a test in the language of the country where they plan to work. The data below shows the relationship between the number of years that employees have studied a particular language and the grades they received on the proficiency exam. Construct a prediction interval for given , and .

(Multiple Choice)
4.9/5 (39)
Provide an appropriate response.
-The data below are the scores of 10 randomly selected students from a statistics class and the number of hours they slept the night before the exam. Construct a prediction interval for , the score on the final exam, given hours, and .
Hours, x 3 5 2 8 2 4 4 5 6 3 Scores, y 65 80 60 88 66 78 85 90 90 71
(Multiple Choice)
4.9/5 (41)
Provide an appropriate response.
-Is a confidence interval or a prediction interval the wider interval at the same level of significance
(Multiple Choice)
4.8/5 (33)
Use Technology to Find a Multiple Regression Equation
-A minor league baseball team posted the following data for its 16 best players. What is the regression equation?
(Multiple Choice)
4.8/5 (33)
Filters
- Essay(0)
- Multiple Choice(0)
- Short Answer(0)
- True False(0)
- Matching(0)