Exam 14: Inference of the Least-Squares Regression Model and Multiple Regression
Exam 1: Data Collection118 Questions
Exam 2: Creating Tables and Drawing Pictures of Data77 Questions
Exam 3: Numerically Summarizing Data158 Questions
Exam 4: Describing the Relation Between Two Variables183 Questions
Exam 5: Probability266 Questions
Exam 6: Discrete Probability Distributions149 Questions
Exam 7: The Normal Probability Distribution123 Questions
Exam 8: Sampling Distributions46 Questions
Exam 9: Estimating the Value of a Parameter Using Confidence Intervals109 Questions
Exam 10: Hypothesis Tests Regarding a Parameter156 Questions
Exam 11: Inference on Two Samples125 Questions
Exam 12: Inference on Categorical Data39 Questions
Exam 13: Comparing Three or More Means51 Questions
Exam 14: Inference of the Least-Squares Regression Model and Multiple Regression82 Questions
Exam 15: Nonparametric Statistics74 Questions
Select questions type
Compute the Standard Error of the Estimate
-Find the standard error of estimate, , for the data below, given that .
-5 -3 4 1 -1 -2 0 2 3 -4 -10 -8 9 1 -2 -6 -1 3 6 -8
(Multiple Choice)
4.7/5  (40)
(40)
Construct Confidence and Prediction Intervals
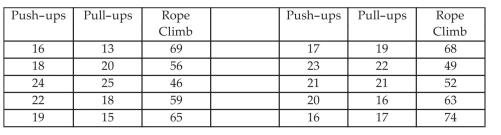
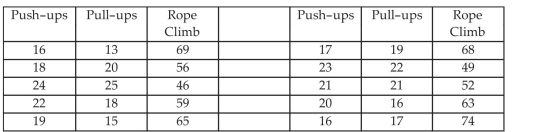
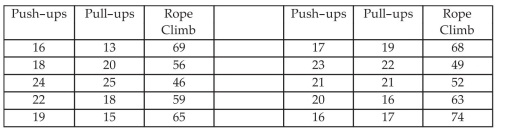
-A gym teacher uses three exercises to increase arm strength: push-ups, pull-ups, and rope climbing. He has 10 students in small class. The exercises consist of doing as many push-ups as possible in 2 minutes. After a rest the student does as many push-ups as possible in 2 minutes. After a rest the student climbs a rope and the time is recorded in seconds. The data for this class is given below. Construct a prediction interval for the Rope Climb Time if the student's Pull-ups are
(Multiple Choice)
4.8/5 (34)
Construct Confidence and Prediction Intervals
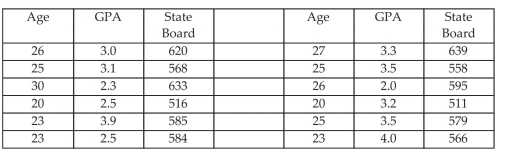
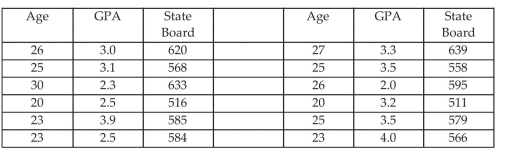
-Twelve nursing students are set to graduate and the registration clerk at the nursing school wonders if there is a correlation between a student's age, their GPA and their state board score. She collects data about the 12 students. The data is given below. Construct a prediction interval for the State Board Score a student will get if the student's age is 24 .
(Multiple Choice)
4.8/5 (32)
Interpret the Coefficients of a Multiple Regression Equation
-Given the regression equation that relates a student's weight to the number of hours spent on the computer, , the number of hours viewing television, , and the number of hours on their cell phone, , per day as . What is a student's expected weight change if the amount of television is increased by 1 hour, the number of hours watching television and talking on their cell phone stayed the same?
(Multiple Choice)
4.8/5 (35)
Build a Regression Model
-Can happiness be predicted? A researcher is investigating whether job satisfaction, income, and health could be good predictors of happiness. She selects a random sample of working adults and obtains the following information for each person. Each person is asked to rate their happiness and their job satisfaction on a scale of 1 to 10 . Each person is asked their annual income. Finally, each person's overall physical health is evaluated by a doctor and rated on a scale of 1 to 20 . The results are shown in the table.
Happiness Job satisfaction Annual Income (thousands of dollars) Health 8 6 38 14 6 5 47 17 4 2 19 12 7 5 22 11 2 3 36 5 9 7 44 14 4 3 75 8 6 8 24 13 7 4 52 14 3 3 27 5 5 4 105 12 8 9 44 7
(a) Construct the correlation matrix. Is there any reason to be concerned with collinearity?
(b) Find the least squares regression equation , where is job satisfaction, is income, is health, and is the response variable "happiness".
(c) Test versus : at least one of the at the level of significance.
(d) Test the hypotheses versus versus , and versus at the level of significance.
Should any of the explanatory variables be removed from the model? If so, which one? Why?
(e) Determine the least squares regression equation with the explanatory variable identified in part (d) removed.
(f) Are both slope coefficients significantly different from zero? If not, remove the appropriate explanatory variable and compute the new least squares regression equation.
(g) How does the -value for your final regression equation compare with the -value for the original equation in part (b)? What does this imply?
(Short Answer)
4.9/5 (33)
Perform an F-test for Lack of Fit
-By saying that we reject the null hypothesis in a hypothesis test of the coefficients of a multiple linear regression we are implying that
(Multiple Choice)
4.8/5 (29)
Compute the Standard Error of the Estimate
-The data below are the final exam scores of 10 randomly selected engineering students and the number of hours they slept the night before the exam. Find the standard error of estimate, se given that .
Hours, 3 5 2 8 2 4 4 5 6 3 Scores, 65 80 60 88 66 78 85 90 90 71
(Multiple Choice)
4.9/5 (40)
Perform an F-test for Lack of Fit
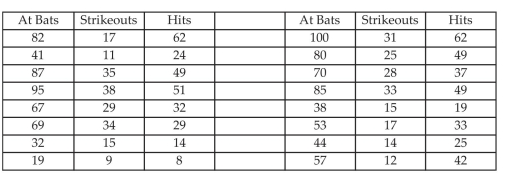
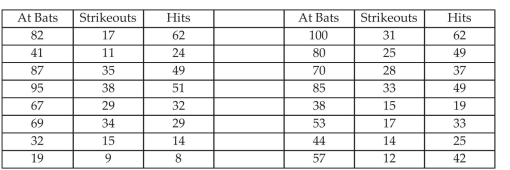
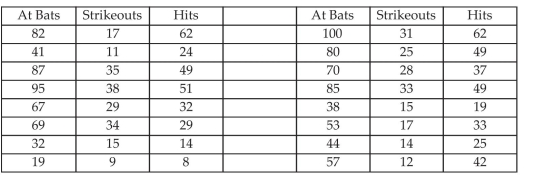
-A minor league baseball team posted the following data for its 16 best players. Test the null hypothesis that all coefficients are zero at the confidence level.
(Multiple Choice)
4.8/5 (34)
Determine R^2 and Adjusted R^2
-A minor league baseball team posted the following data for its 16 best players. Determine for the multiple regression model where is At Bats, is Strikeouts, and is the response variable "Hits".
(Multiple Choice)
4.8/5 (35)
Determine R^2 and Adjusted R^2
-A gym teacher uses three exercises to increase arm strength: push-ups, pull-ups, and rope climbing. He has 10 students in his class. He records the number of push ups each student is able to do in 2 minutes, the number of pull ups each student is able to do in 2 minutes, and the time (in seconds) for each student to climb a rope. The data are shown in the table. The teacher wonders whether the number of push ups and the number of pull ups would be good predictors of the time to climb the rope. Determine for the multiple regression model where is Push Ups, is Pull Ups, and is the response variable "Rope Climb".
(Multiple Choice)
4.8/5 (28)
Compute the Standard Error of the Estimate
-In an area of the Great Plains, records were kept on the relationship between the rainfall (in inches) and the yield of wheat (bushels per acre). Find the standard error of estimate, se given that .

(Multiple Choice)
4.8/5 (30)
Construct Confidence Intervals for a Mean Response
-In order for a company's employees to work at a foreign office, they must take a test in the language of the country where they plan to work. The data below shows the relationship between the number of years that employees have studied a particular language and the grades they received on the proficiency exam. Construct a confidence interval about the mean value of , given , and .
Number of years, 3 4 4 5 3 6 2 7 3 Grades on test, 61 68 75 82 73 90 58 93 72
(Multiple Choice)
4.7/5 (34)
Construct a Confidence Interval about the Slope of the Least -squares Regression Model
-Construct a confidence interval about the slope of the true least-squares regression line, for the data below, given that .
x -5 -3 4 1 -1 -2 0 2 3 -4 y -10 -8 9 1 -2 -6 -1 3 6 -8
(Multiple Choice)
4.8/5 (33)
Compute the Standard Error of the Estimate
-Find the standard error of estimate, , for the data below, given that .
-5 -3 4 1 -1 -2 0 2 3 -4 11 -6 8 -3 -2 1 5 -5 6 7
(Multiple Choice)
4.9/5 (35)
Construct Confidence Intervals for a Mean Response
-The data below are the scores of 10 randomly selected students from a statistics class and the number of hours they slept the night before the exam. Construct a confidence interval about the mean value of , the score on the final exam, given hours, and .
Hours, 3 5 2 8 2 4 4 5 6 3 Scores, 65 80 60 88 66 78 85 90 90 71
(Multiple Choice)
4.8/5 (28)
Construct Confidence and Prediction Intervals
-A minor league baseball team posted the following data for its 16 best players. Construct a prediction interval for the number of hits player will get if the player is at bat 53 times.
(Multiple Choice)
4.8/5 (27)
Conduct Inference on the Slope
-The data below are the ages and systolic blood pressures (measured in millimeters of mercury) of 9 randomly selected adults. Test the claim, at the level of significance, that a linear relation exists between the two variables, given that

(Essay)
4.9/5 (34)
Compute the Standard Error of the Estimate
-Find the standard error of estimate, , for the data below, given that .
(Multiple Choice)
4.9/5 (25)
Determine R^2 and Adjusted R^2
-Twelve nursing students are set to graduate and the registration clerk at the nursing school wonders if a student's age and GPA would be good predictors of their state board score. She obtains the following data.
Determine the adjusted for the multiple regression model where is Age, is GPA, and is the response variable "state board score".
(Multiple Choice)
4.9/5 (40)
Obtain the Correlation Matrix
-A gym teacher uses three exercises to increase arm strength: push-ups, pull-ups, and rope climbing. He has 10 students in small class. The exercises consist of doing as many push-ups as possible in 2 minutes. After a rest the student does as many push-ups as possible in 2 minutes. After a rest the student climbs a rope and the time is recorded in seconds. The data for this class is given below. What is the correlation between pull-ups and the time to climb the rope?
(Multiple Choice)
4.8/5 (41)
Filters
- Essay(0)
- Multiple Choice(0)
- Short Answer(0)
- True False(0)
- Matching(0)