Exam 3: Numerically Summarizing Data
Exam 1: Data Collection118 Questions
Exam 2: Creating Tables and Drawing Pictures of Data77 Questions
Exam 3: Numerically Summarizing Data158 Questions
Exam 4: Describing the Relation Between Two Variables183 Questions
Exam 5: Probability266 Questions
Exam 6: Discrete Probability Distributions149 Questions
Exam 7: The Normal Probability Distribution123 Questions
Exam 8: Sampling Distributions46 Questions
Exam 9: Estimating the Value of a Parameter Using Confidence Intervals109 Questions
Exam 10: Hypothesis Tests Regarding a Parameter156 Questions
Exam 11: Inference on Two Samples125 Questions
Exam 12: Inference on Categorical Data39 Questions
Exam 13: Comparing Three or More Means51 Questions
Exam 14: Inference of the Least-Squares Regression Model and Multiple Regression82 Questions
Exam 15: Nonparametric Statistics74 Questions
Select questions type
Determine the Mode of a Variable from Raw Data
-The following data represent the bachelor degrees of CEO s at area small businesses. Determine the mode degree. Degree Number Accounting 24 Business 47 Liberal Arts 11 Marketing 21 Other 15
Free
(Multiple Choice)
4.9/5  (33)
(33)
Correct Answer: Verified
A
Provide an appropriate response.
-The following data are the yields, in bushels, of hay from a farmer s last 10 years: 375, 210, 150, 147, 429, 189, 320, 580, 407, 180. Find the IQR.
Free
(Multiple Choice)
4.9/5 (35)
Correct Answer:Verified
A
Determine and Interpret z-Scores
-Test scores for a statistics class had a mean of 79 with a standard deviation of 4.5. Test scores for a calculus class had a mean of 69 with a standard deviation of 3.7. Suppose a student gets a 60 on the statistics test and a 87 on the calculus test. Calculate the z-score for each test. On which test did the student perform better relative to the other students in each class
Free
(Short Answer)
4.8/5 (36)
Correct Answer:Verified
Provide an appropriate response.
-In distributions that are skewed to the left, what is the relationship of the mean, median, and mode
(Multiple Choice)
4.9/5 (34)
Use the Empirical Rule to Describe Data That Are Bell Shaped
-Health care issues are receiving much attention in both academic and political arenas. A sociologist recently conducted a survey of citizens over 60 years of age whose net worth is too high to qualify for government health care but who have no private health insurance. The ages of 25 uninsured senior citizens were as follows:
68 73 66 76 86 74 61 89 65 90 69 92 76
62 81 63 68 81 70 73 60 87 75 64 82
Suppose the mean and standard deviation are and , respectively. If we assume that the distribution of ages is bell shaped, what percentage of the respondents will be between and years old?
(Multiple Choice)
4.7/5 (43)
Approximate the Variance and Standard Deviation of a Variable from Grouped Data
-For the following data set, approximate the sample standard deviation of unused vacation days. Days Frequency 1-2 9 3-4 12 5-6 8 7-8 5 9-10 4
(Multiple Choice)
4.8/5 (26)
Determine and Interpret Quartiles
-Health care issues are receiving much attention in both academic and political arenas. A sociologist recently conducted a survey of citizens over 60 years of age whose net worth is too high to qualify for government health care but who have no private health insurance. The ages of 25 uninsured senior citizens were as follows: 68 73 66 76 86 74 61 89 65 90 69 92 76
62 81 63 68 81 70 73 60 87 75 64 82
Find of the data.
(Multiple Choice)
4.9/5 (39)
Provide an appropriate response.
-Jim buys his school supplies in bulk. On one particular shopping trip he bought 5 red pens at each, 3 blue pens at each, 6 green pens at each and 9 black pens at each. What was the average cost of a pen?
(Multiple Choice)
4.9/5 (31)
Determine and Interpret z-Scores
-A study was designed to investigate the effects of two variables - (1) a student s level of mathematical anxiety and (2) teaching method - on a student s achievement in a mathematics course. Students who had a low level of mathematical anxiety were taught using the traditional expository method. These students obtained a mean score of 300 and a standard deviation of 40 on a standardized test. Find and interpret the z-score of a student who scored 320 on the standardized test.
(Short Answer)
4.8/5 (34)
Provide an appropriate response.
-The normal monthly precipitation (in inches) for August is listed for 20 different U.S. cities. Find any outliers and provide an explanation for them. 0.4 1.0 1.5 1.6 2.0 2.2 2.4 2.7 3.4 3.4 3.5 3.6 3.6 3.7 3.7 3.9 4.1 4.2 4.2 7.0
(Essay)
4.8/5 (32)
Draw and Interpret Boxplots
-In interpreting a boxplot of a data set we note that the median is to the left of the center of the box and the right line is longer than the left line. We can conclude that
(Multiple Choice)
4.8/5 (33)
Use Chebyshev s Inequality to Describe Any Set of Data
-Commuting times for employees of a local company have a mean of 63.6 minutes and a standard deviation of 2.5 minutes. What does Chebyshev s Theorem say about the percentage of employees with commuting times between 56.1 minutes and 71.1 minutes
(Essay)
4.8/5 (25)
Provide an appropriate response.
-Eleven high school teachers were asked to give the number of students in their classes. The sample data follows. Would any of the class sizes be considered an outlier? Answer Yes or No.
36, 31, 30, 31, 20, 19, 24, 34, 21, 28, 24
(Multiple Choice)
4.8/5 (34)
Provide an appropriate response.
-Many firms use on-the-job training to teach their employees new software. Suppose you work in the personnel department of a firm that just finished training a group of its employees in new software, and you have been requested to review the performance of one of the trainees on the final test that was given to all trainees. The mean of the test scores is 70. Additional information indicated that the median of the test scores was 76. What type of distribution most likely describes the shape of the test scores
(Multiple Choice)
4.9/5 (26)
Provide an appropriate response.
-An Excel printout of some descriptive statistics for a set of data is shown below. What is the IQR 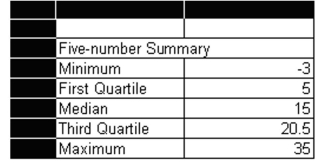
(Multiple Choice)
4.9/5 (29)
Provide an appropriate response.
-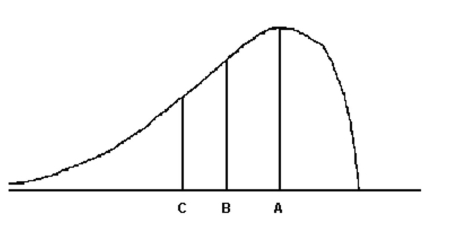 For the distribution drawn here, identify the mean, median, and mode.
(Multiple Choice)
4.8/5 (35)
Compute the Standard Deviation of a Variable from Raw Data
-The costs (in dollars) of 10 college math textbooks are listed below. Find the population standard deviation and the population variance.
70 72 71 70 69 73 69 68 70 71
(Short Answer)
4.9/5 (41)
Approximate the Variance and Standard Deviation of a Variable from Grouped Data
-On a recent day during the flu season, the Midtown Medical Clinic saw many patients. Patients had their temperatures taken (in °F). The distribution of temperatures is given below. Determine the standard deviation of the temperatures of a sample of 100 patients. Temperatures Frequency 95.6-96.49 1 96.5-97.39 3 97.4-98.29 19 98.3-99.19 28 99.2-100.09 35 100.1-100.99 12 101.0-101.89 2
(Multiple Choice)
4.9/5 (38)
Provide an appropriate response.
-Eleven high school teachers were asked to give the numbers of students in their classes. The sample data follows: , 24. Find the five-number summary.
(Short Answer)
4.9/5 (37)
Compute the Standard Deviation of a Variable from Raw Data
-
(Multiple Choice)
4.8/5 (31)
Filters
- Essay(0)
- Multiple Choice(0)
- Short Answer(0)
- True False(0)
- Matching(0)