Exam 11: Inference on Two Samples
Exam 1: Data Collection118 Questions
Exam 2: Creating Tables and Drawing Pictures of Data77 Questions
Exam 3: Numerically Summarizing Data158 Questions
Exam 4: Describing the Relation Between Two Variables183 Questions
Exam 5: Probability266 Questions
Exam 6: Discrete Probability Distributions149 Questions
Exam 7: The Normal Probability Distribution123 Questions
Exam 8: Sampling Distributions46 Questions
Exam 9: Estimating the Value of a Parameter Using Confidence Intervals109 Questions
Exam 10: Hypothesis Tests Regarding a Parameter156 Questions
Exam 11: Inference on Two Samples125 Questions
Exam 12: Inference on Categorical Data39 Questions
Exam 13: Comparing Three or More Means51 Questions
Exam 14: Inference of the Least-Squares Regression Model and Multiple Regression82 Questions
Exam 15: Nonparametric Statistics74 Questions
Select questions type
Test Hypotheses Regarding the Difference of Two Independent Means
-Find the standardized test statistic, t, to test the hypothesis that . Two samples are randomly selected and come from populations that are normal. The sample statistics are given below.
=11 =18 1=5.1 2=5.5 1=0.76 =0.51
Free
(Multiple Choice)
5.0/5  (30)
(30)
Correct Answer: Verified
A
Test Hypotheses Regarding Two Population Standard Deviations
-A university wants to see whether there is a significant difference in the variances of the ages between day staff and night staff. A random sample of 31 staff members is selected from each group. The data are given below. Test the hypothesis that there is no difference in age between the two groups.
Use .
Day Staff
22 24 24 23 19 19 23 22 18 21 21 18 18 25 29 24 23 22 22 21 20 20 20 27 17 19 18 21 20 23 26
Evening Staff
18 23 25 23 21 21 23 24 27 31 34 20 20 23 19 25 24 27 23 20 20 21 25 24 23 28 20 19 23 24 20
Assume the samples were randomly selected from normal populations.
Free
(Short Answer)
4.8/5 (35)
Correct Answer:Verified
right-hand critical value ; test statistic ; fail to reject ; There is not sufficient evidence to reject the hypothesis.
Test Hypotheses Regarding Two Population Standard Deviations
-A medical researcher suspects that the variance of the pulse rate of drinkers is higher than the variance of the pulse rate of non-drinkers. Use the sample statistics below to test the researcher's suspicion. Use
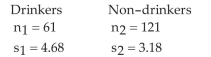 Assume the samples were randomly selected from normal populations.
Free
(Short Answer)
4.9/5 (35)
Correct Answer:Verified
Determine the Appropriate Hypothesis Test to Perform
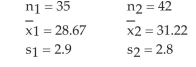
-A random sample of 100 male employees of a retail store results in a mean monthly salary of with a standard deviation of . An independent random sample of 125 female employees of the same store results in a mean monthly salary of with a standard deviation of . Does this constitute sufficient evidence to conclude that the mean monthly salary for male employees of the store is higher than the mean monthly salary for female employees of the store? Use the level of significance.
(Short Answer)
4.9/5 (35)
Test Hypotheses Regarding Matched-Pairs Data
-Robustness in hypothesis testing means
(Multiple Choice)
4.9/5 (40)
Provide an appropriate response.
-In a recent survey of drinking laws, a random sample of 1000 women showed that were in favor of increasing the legal drinking age. In a random sample of favored increasing the legal drinking age. Test the hypothesis that the percentage of men and women favoring a higher legal drinking age is the same. Use .
(Short Answer)
4.8/5 (32)
Construct and Interpret Confidence Intervals for the Difference between Two Population Proportions
-A random sample of 100 students at a high school was asked whether they would ask their father or mother for help with a financial problem. A second sample of 100 different students was asked the same question regarding a dating problem. Forty-three students in the first sample and 47 students in the second sample replied that they turned to their mother rather than their father for help. Construct a confidence interval for .
(Multiple Choice)
5.0/5 (32)
Test Hypotheses Regarding the Difference of Two Independent Means
-Find the standardized test statistic to test the hypothesis that . Two samples are randomly selected from each population. The sample statistics are given below. Use .
=100 =125 1=545 =530 1=45 =25
(Multiple Choice)
4.9/5 (19)
Construct and Interpret Confidence Intervals Regarding the Difference of Two Independent Means
-A study was conducted to determine if the salaries of librarians from two neighboring cities were equal. A sample of 15 librarians from each city was randomly selected. The mean from the first city was with a standard deviation of . The mean from the second city was with a standard deviation of . Construct a confidence interval for .
(Multiple Choice)
4.8/5 (33)
Construct and Interpret Confidence Intervals for the Difference between Two Population Proportions
-To construct a confidence interval for the difference of two population proportions the samples must be independently obtained random samples, both must consist of less than of the population, and
(Multiple Choice)
4.8/5 (31)
Test Hypotheses Regarding the Difference of Two Independent Means
-Test the hypothesis that . Two samples are randomly selected from each population. The sample statistics are given below. Use .
(Short Answer)
4.9/5 (25)
Construct and Interpret Confidence Intervals for the Difference between Two Population Proportions
-Construct a confidence interval for . The sample statistics listed below are from independent samples.
Sample statistics: , and
(Multiple Choice)
4.8/5 (27)
Determine the Appropriate Hypothesis Test to Perform
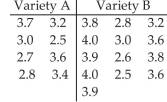
-A random samples of 8 apples of variety A and an independent random sample of 13 apples of variety B yielded the following weights in ounces. Do the data provide sufficient evidence to conclude that the mean weight of apples of variety A differs from the mean weight of apples of variety B? U se the level of significance. Assume that the sample data come from normally distributed populations with no outliers.
(Short Answer)
4.9/5 (29)
Find Critical Values of the F-distribution
-Find the left-tailed and right tailed critical F-values for a two-tailed test. Use the sample statistics below. Let .
=5 =6 =5.8 =2.7
(Short Answer)
4.9/5 (35)
Test Hypotheses Regarding Two Population Standard Deviations
-An algebra teacher believes that the variances of test scores of students in her evening algebra class are lower than the variances of test scores of students in her morning class. The results of an exam, given to the morning and evening students, are shown below. Can the teacher conclude that her evening students have a lower variance? Use .
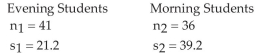 Assume the samples were randomly selected from normal populations.
(Short Answer)
4.9/5 (23)
Test Hypotheses Regarding Matched-Pairs Data
-Data sets and are dependent. Find .
7.2 8.2 10.1 7.1 7.2 9.6 8.5 8.4 8.3 9.7
Assume that the paired data came from a population that is normally distributed.
(Multiple Choice)
4.8/5 (41)
Test Hypotheses Regarding Matched-Pairs Data
-Data sets and are dependent. Find .
A 32 30 49 45 33 B 30 26 27 37 24
Assume that the paired data came from a population that is normally distributed.
(Multiple Choice)
5.0/5 (39)
Find Critical Values of the F-distribution
-Two conditions are required to test a claim about two population standard deviations. What are they?
(Multiple Choice)
4.8/5 (36)
Test Hypotheses Regarding the Difference of Two Independent Means
-A medical researcher suspects that the pulse rate of drinkers is higher than the pulse rate of non-drinkers. Use the sample statistics below to test the researcher's suspicion. Use .
Drinkers Nondrinkers =100 =100 =86 2=83 =4.8 =5.3
(Short Answer)
4.8/5 (29)
Test Hypotheses Regarding Two Population Standard Deviations
-At a retail store, 61 female employees were randomly selected and it was found that their monthly income had a standard deviation of . For 121 male employees, the standard deviation was . Test the hypothesis that variance of monthly incomes is higher for male employees than it is for female employees. Use . Assume the samples were randomly selected from normal populations.
(Short Answer)
4.8/5 (33)
Filters
- Essay(0)
- Multiple Choice(0)
- Short Answer(0)
- True False(0)
- Matching(0)