Exam 4: Describing the Relation Between Two Variables
Exam 1: Data Collection118 Questions
Exam 2: Creating Tables and Drawing Pictures of Data77 Questions
Exam 3: Numerically Summarizing Data158 Questions
Exam 4: Describing the Relation Between Two Variables183 Questions
Exam 5: Probability266 Questions
Exam 6: Discrete Probability Distributions149 Questions
Exam 7: The Normal Probability Distribution123 Questions
Exam 8: Sampling Distributions46 Questions
Exam 9: Estimating the Value of a Parameter Using Confidence Intervals109 Questions
Exam 10: Hypothesis Tests Regarding a Parameter156 Questions
Exam 11: Inference on Two Samples125 Questions
Exam 12: Inference on Categorical Data39 Questions
Exam 13: Comparing Three or More Means51 Questions
Exam 14: Inference of the Least-Squares Regression Model and Multiple Regression82 Questions
Exam 15: Nonparametric Statistics74 Questions
Select questions type
Provide an appropriate response.
-Calculate the linear correlation coefficient for the data below.

Free
(Multiple Choice)
4.9/5  (35)
(35)
Correct Answer: Verified
A
Explain the Difference between Correlation and Causation .Provide an appropriate response.
-A variable that is related to either the response variable or the predictor variable or both, but which is excluded from the analysis is a
Free
(Multiple Choice)
4.9/5 (34)
Correct Answer:Verified
A
Write the word or phrase that best completes each statement or answers the question.
Provide an appropriate response.
-Construct a scatter diagram for the given data. Determine whether there is a positive linear correlation, negative linear correlation, or no linear correlation.
-5 -3 4 1 -1 -2 0 2 3 -4 11 -6 8 -3 -2 1 5 -5 6 7
Free
(Essay)
4.9/5 (32)
Correct Answer:Verified
There appears to be no linear correlation. 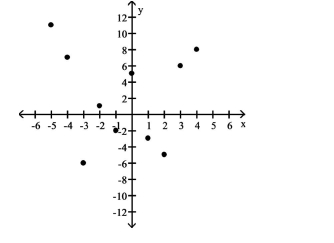
Choose the one alternative that best completes the statement or answers the question.
-A manufacturer of boiler drums wants to use regression to predict the number of man-hours needed to erect drums in the future. The manufacturer collected a random sample of 35 boilers and measured the following two variables:
MANHRS: = Number of man-hours required to erect the drum
PRESSURE: Boiler design pressure (pounds per square inch, i.e., psi)
Initially, the simple linear model was fit to the data. A printout for the analysis appears below:
UNWEIGHTED LEAST SQUARES LINEAR REGRESSION OF MANHRS
PREDICTOR VARIABLES COEFFICIENT STD ERROR STUDENT'ST CONSTANT 1.88059 0.58380 3.22 0.0028 PRESSURE 0.00321 0.00163 2.17 0.0300
R-SQUARED 0.4342 RESID. MEAN SQUARE (MSE) 4.25460 ADJUSTED R-SQUARED 0.4176 STANDARD DEVIATION 2.06267
SOURCE DF SS MS REGRESSION 1 111.008 111.008 5.19 0.0300 RESIDUAL 34 144.656 4.25160 TOTAL 35 255.665
Give a practical interpretation of the coefficient of determination, .
(Multiple Choice)
4.8/5 (34)
Interpret the Slope and the y-intercept of the Least-Squares Regression Line
-A real estate magazine reported the results of a regression analysis designed to predict the price (y), measured in dollars, of residential properties recently sold in a northern Virginia subdivision. One independent variable used to predict sale price is GLA, gross living area ( ), measured in square feet. Data for 157 properties were used to fit the model, . The results of the simple linear regression are provided below.
Interpret the estimate of , the -intercept of the line.
(Multiple Choice)
4.9/5 (33)
Provide an appropriate response.
-The following data represent the living situation of newlyweds in a large metropolitan area and their annual household income. What percent of people who own their own home make between and per year?
<\ 20,000 \ 20-35,000 \ 35-50,000 \ 50-75,000 >\ 75,000 Own home 31 52 202 355 524 Rent home 67 66 52 23 11 Live w/family 89 69 30 4 2
(Multiple Choice)
4.8/5 (38)
Choose the one alternative that best completes the statement or answers the question.
Use the scatter diagrams shown, labeled a through f to solve the problem.
-A scatter diagram locates a point in a two dimensional plane. The diagram locates the variable on the horizontal axis and the variable on the vertical axis.
(Multiple Choice)
4.8/5 (28)
Compute the linear correlation coefficient between the two variables and determine whether a linear relation exists.
-The table shows the number of days off last year and the earnings for the year (in thousands of dollars) for nine randomly selected insurance salesmen.

(Multiple Choice)
4.9/5 (34)
Compute the linear correlation coefficient between the two variables and determine whether a linear relation exists.
-To investigate the relationship between yield of soybeans and the amount of fertilizer used, a researcher divides a field into eight plots of equal size and applies a different amount of fertilizer to each plot. The table shows the yield of soybeans and the amount of fertilizer used for each plot.
Amount of fertilizer (pounds), 1 1.5 2 2.5 3 3.5 4 4.5 Yield of soybeans (pounds), y 25 21 27 28 36 35 32 34
(Multiple Choice)
4.9/5 (30)
Compute the linear correlation coefficient between the two variables and determine whether a linear relation exists.
-A manager wishes to determine whether there is a relationship between the number of years her sales representatives have been with the company and their average monthly sales. The table shows the years of service for each of her sales representatives and their average monthly sales (in thousands of dollars).
Years with company, x 4 5 12 9 10 17 5 3 13 Sales, y 21 23 68 52 55 51 38 45 110
(Multiple Choice)
4.9/5 (36)
Choose the one alternative that best completes the statement or answers the question.
-Civil engineers often use the straight-line equation, , to model the relationship between the mean shear strength of masonry joints and precompression stress, . To test this theory, a series of stress tests were performed on solid bricks arranged in triplets and joined with mortar. The precompression stress was varied for each triplet and the ultimate shear load just before failure (called the shear strength) was recorded. The stress results for triplet tests is shown in the accompanying table followed by a SAS printout of the regression analysis.
Triplet Test 1 2 3 4 5 6 7 Shear Strength (tons), 1.00 2.18 2.24 2.41 2.59 2.82 3.06 Precomp. Stress (tons), 0 0.60 1.20 1.33 1.43 1.75 1.75
Sum of Mean Source DF Squares Square F Value Prob > F Model 1 2.39555 2.39555 47.732 0.0010 Error 5 0.25094 0.05019 C Total 6 2.64649
Root MSE 0.22403 R-square 0.9052 Dep Mean 2.32857 Adj R-sq 0.8862 C.V. 9.62073
Parameter Estimates Parameter Standard T for HO: Variable DF Estimate Error Parameter =0 Prob >|| INTERCEP 1 1.191930 0.18503093 6.442 0.0013 1 0.987157 0.14288331 6.909 0.0010
Give a practical interpretation of , the coefficient of determination for the least squares model.
(Multiple Choice)
4.9/5 (33)
Write the word or phrase that best completes each statement or answers the question.
Construct a scatter diagram for the data.
-The data below are the number of absences and the final grades of 9 randomly selected students from a literature class.
Number of absences, x 0 3 6 4 9 2 15 8 5 Final grade, y 98 86 80 82 71 92 55 76 82
(Short Answer)
4.9/5 (37)
Choose the one alternative that best completes the statement or answers the question.
-In an area of Russia, records were kept on the relationship between the rainfall (in inches) and the yield of wheat (bushels per acre). The data for a 9 year period is as follows:
Rain Fall, x 13.1 11.4 16.0 15.1 21.4 12.9 9.6 18.2 18.6 Yield, y 48.5 44.2 56.8 80.4 47.2 29.9 74.0 74.0 76.8
The equation of the line of least squares is given as . What would be the expected number of inches of rain if the yield is 60 bushels of wheat per acre?
(Multiple Choice)
4.8/5 (38)
Interpret the Slope and the y-intercept of the Least-Squares Regression Line
-Is there a relationship between the raises administrators at State University receive and their performance on the job? A faculty group wants to determine whether job rating (x) is a useful linear predictor of raise (y). Consequently, the group considered the straight-line regression model, . Using the method of least squares, the faculty group obtained the following prediction equation, . Interpret the estimated slope of the line.
(Multiple Choice)
4.7/5 (27)
A scatter diagram is given with one of the points labeled ʺA.ʺ In addition, there are two least -squares regression lines
drawn. The solid line excludes the point A. The dashed line includes the point A. Based on the graph, is the point A
influential
-What effect will an influential observation have upon the graph of the least squares regression line
(Multiple Choice)
4.9/5 (41)
Change the exponential expression to an equivalent expression involving a logarithm.
-
(Multiple Choice)
4.8/5 (24)
Choose the one alternative that best completes the statement or answers the question.
-The coefficient of determination is the of the linear correlation coefficient.
(Multiple Choice)
4.8/5 (34)
Choose the one alternative that best completes the statement or answers the question.
-The measures the percentage of total variation in the response variable that is explained by the least squares regression line.
(Multiple Choice)
4.8/5 (45)
Compute the Sum of Squared Residuals
-The regression line for the given data is . Determine the residual of a data point for which 8 and .
Hours, 3 5 2 8 2 4 4 5 6 3 Scores, 65 80 60 88 66 78 85 90 90 71
(Multiple Choice)
4.8/5 (32)
Filters
- Essay(0)
- Multiple Choice(0)
- Short Answer(0)
- True False(0)
- Matching(0)