Exam 14: Inference of the Least-Squares Regression Model and Multiple Regression
Exam 1: Data Collection118 Questions
Exam 2: Creating Tables and Drawing Pictures of Data77 Questions
Exam 3: Numerically Summarizing Data158 Questions
Exam 4: Describing the Relation Between Two Variables183 Questions
Exam 5: Probability266 Questions
Exam 6: Discrete Probability Distributions149 Questions
Exam 7: The Normal Probability Distribution123 Questions
Exam 8: Sampling Distributions46 Questions
Exam 9: Estimating the Value of a Parameter Using Confidence Intervals109 Questions
Exam 10: Hypothesis Tests Regarding a Parameter156 Questions
Exam 11: Inference on Two Samples125 Questions
Exam 12: Inference on Categorical Data39 Questions
Exam 13: Comparing Three or More Means51 Questions
Exam 14: Inference of the Least-Squares Regression Model and Multiple Regression82 Questions
Exam 15: Nonparametric Statistics74 Questions
Select questions type
Provide an appropriate response.
-In an area of the Great Plains, records were kept on the relationship between the rainfall (in inches) and the yield of wheat (bushels per acre). Construct a prediction interval for , the yield, given inches, and

(Multiple Choice)
4.8/5  (26)
(26)
Construct Confidence and Prediction Intervals
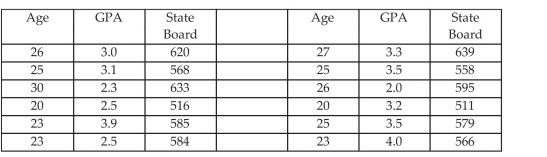
-Twelve nursing students are set to graduate and the registration clerk at the nursing school wonders if there is a correlation between a student's age, their GPA and their state board score. She collects data about the 12 students. The data is given below. Construct a confidence interval for the State Board Score a student will get if the student's age is 24 .
(Multiple Choice)
4.8/5 (38)
Construct Confidence Intervals for a Mean Response
-Construct a confidence interval about the mean value of , given and .
-5 -3 4 1 -1 -2 0 2 3 -4 -10 -8 9 1 -2 -6 -1 3 6 -8
(Multiple Choice)
4.7/5 (33)
Compute the Standard Error of the Estimate
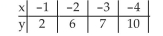
-Find the standard error of estimate, , for the data below, given that .
-1 -2 -3 -4 2 6 7 10
(Multiple Choice)
4.8/5 (33)
Conduct Inference on the Slope
-Test the claim, at the level of significance, that a linear relation exists between the two variables, for the data below, given that .
(Essay)
4.8/5 (37)
The difference between the observed and predicted value of the response variable is a_____
(Multiple Choice)
4.8/5 (24)
Obtain the Correlation Matrix
-A correlation matrix shows the linear correlation among _____variables under consideration in a multiple regression model.
(Multiple Choice)
4.8/5 (43)
Test Individual Regression Coefficients for Significance
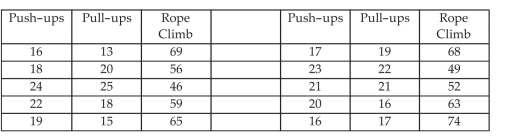
-A gym teacher uses three exercises to increase arm strength: push-ups, pull-ups, and rope climbing. He has 10 students in small class. The exercises consist of doing as many push-ups as possible in 2 minutes. After a rest the student does as many push-ups as possible in 2 minutes. After a rest the student climbs a rope and the time is recorded in seconds. The data for this class is given below. Test the significance of the individual predictor variables at .
(Multiple Choice)
4.9/5 (40)
Construct Confidence Intervals for a Mean Response
-When constructing a confidence interval about the mean response of in a linear regression, the -distribution is used with _____degrees of freedom.
(Multiple Choice)
4.9/5 (38)
Construct Confidence Intervals for a Mean Response
-In an area of Russia, records were kept on the relationship between the rainfall (in inches) and the yield of wheat (bushels per acre). Construct a confidence interval about the mean value of , the yield, given inches, and .
Rainfall (in inches), 10.5 8.8 13.4 12.5 18.8 10.3 7.0 15.6 16.0 Yield (bushels per acre), 50.5 46.2 58.8 59.0 82.4 49.2 31.9 76.0 78.8
(Multiple Choice)
5.0/5 (32)
Compute the Standard Error of the Estimate
-The data below are the number of absences and the final grades of 9 randomly selected students in an engineering class. Find the standard error of estimate, , given that .

(Multiple Choice)
4.7/5 (36)
Compute the Standard Error of the Estimate
-Find the standard error of estimate, , for the data below, given that .
-5 -3 4 1 -1 -2 0 2 3 -4 11 6 -6 -1 3 4 1 -4 -5 8
(Multiple Choice)
4.9/5 (36)
Build a Regression Model
-A researcher is investigating whether exercise, age, and percent body fat could be good predictors of resting pulse rate. She selects a random sample of women and for each woman records their resting pulse rate, the amount they exercise (on a scale of 1 to 10), age, and percent body fat. The results are shown in the table.
Resting Pulse Rate Amount of Exercise Age Percent Body Fat 76 6 22 23 63 8 38 19 82 5 62 25 90 3 54 31 86 2 44 27 77 4 41 24 80 5 59 26 75 4 27 26 58 8 35 16 76 5 76 24 65 9 31 20 85 3 66 28
(a) Construct the correlation matrix. Is there any reason to be concerned with collinearity? Is this what you would expect?
(b) Find the least squares regression equation , where is Exercise, is Age, is Percent body fat, and is the response variable "resting pulse rate".
(c) Test versus : at least one of the at the level of significance.
(d) Test the hypotheses versus versus , and versus : at the level of significance.
Should any of the explanatory variables be removed from the model? If so, which one? Why?
(e) Determine the least squares regression equation with the explanatory variable identified in part (d) removed.
(f) Are both slope coefficients significantly different from zero? Is this what you would expect? If appropriate, remove an explanatory variable and compute the new least squares regression equation.
(g) What is the P-value for your final regression equation? What does this imply?
(Short Answer)
4.8/5 (25)
Conduct Inference on the Slope
-If a hypothesis test of the linear relation between the explanatory and the response variable is of the type where , then we are testing the claim that
(Multiple Choice)
4.7/5 (34)
Provide an appropriate response.
-A breeder of thoroughbred horses wishes to model the relationship between the gestation period and the length of life of a horse. The breeder believes that the two variables may follow a linear trend. The information in the table was supplied to the breeder from various thoroughbred stables across the state. Construct a prediction interval about the value of when days.
Horse Gestation period Life Length x (days) Horse Gestation period Life Length 1 416 24 5 356 22 2 279 25.5 6 403 23.5 3 298 20 7 265 21 4 307 21.5
(Short Answer)
4.8/5 (37)
Compute the Standard Error of the Estimate
-The data below are the ages and systolic blood pressures (measured in millimeters of mercury) of 9 randomly selected adults. Find the standard error of estimate, , given that .

(Multiple Choice)
4.8/5 (33)
Perform an F-test for Lack of Fit
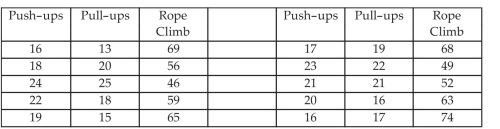
-A gym teacher uses three exercises to increase arm strength: push-ups, pull-ups, and rope climbing. He has 10 students in small class. The exercises consist of doing as many push-ups as possible in 2 minutes. After a rest the student does as many push-ups as possible in 2 minutes. After a rest the student climbs a rope and the time is recorded in seconds. The data for this class is given below. Test the null hypothesis that all coefficients are zero at the confidence level.
(Multiple Choice)
4.8/5 (40)
Interpret the Coefficients of a Multiple Regression Equation
-Why is it important for the explanatory variables to have a low correlation?
(Essay)
4.8/5 (32)
Conduct Inference on the Slope
-The data below are the temperatures on randomly chosen days during the summer and the number of employee absences at a local company on those days. Test the claim, at the level of significance, that a linear relation exists between the two variables, given that .

(Essay)
4.8/5 (32)
Compute the Standard Error of the Estimate
-In a study of feeding behavior, zoologists recorded the number of grunts of a warthog feeding by a lake in the 15 minute period following the addition of food. The data showing the number of grunts and the age of the warthog (in days) are listed below. Compute the standard error, the point estimate for o.
Number of Grunts, y Age (days), x 97 125 75 141 46 155 51 160 70 167 47 174 69 183 24 189 29 195
(Short Answer)
4.9/5 (32)
Filters
- Essay(0)
- Multiple Choice(0)
- Short Answer(0)
- True False(0)
- Matching(0)