Exam 12: Inference on Categorical Data
Exam 1: Data Collection118 Questions
Exam 2: Creating Tables and Drawing Pictures of Data77 Questions
Exam 3: Numerically Summarizing Data158 Questions
Exam 4: Describing the Relation Between Two Variables183 Questions
Exam 5: Probability266 Questions
Exam 6: Discrete Probability Distributions149 Questions
Exam 7: The Normal Probability Distribution123 Questions
Exam 8: Sampling Distributions46 Questions
Exam 9: Estimating the Value of a Parameter Using Confidence Intervals109 Questions
Exam 10: Hypothesis Tests Regarding a Parameter156 Questions
Exam 11: Inference on Two Samples125 Questions
Exam 12: Inference on Categorical Data39 Questions
Exam 13: Comparing Three or More Means51 Questions
Exam 14: Inference of the Least-Squares Regression Model and Multiple Regression82 Questions
Exam 15: Nonparametric Statistics74 Questions
Select questions type
Many track hurdlers believe that they have a better chance of winning if they start in the inside lane that is closest to the field. For the data below, the lane closest to the field is Lane 1, the next lane is Lane 2, and so on until the outermost lane, Lane 6. The data lists the number of wins for track hurdlers in the different starting positions. Test the claim that the probabilities of winning are the same in the different positions. Use . The results are based on 240 wins.
Starting Position 1 2 3 4 5 6 Number of Wins 36 33 32 45 44 50
(Short Answer)
4.9/5  (42)
(42)
The degrees of freedom for a goodness-of-fit test when there are 6 categories and a sample of size 1200 is
(Multiple Choice)
4.9/5 (36)
Perform a Test for Independence
-A sports statistician is interested in determining if there is a relationship between the number of home team and visiting team losses and different sports. A random sample of 526 games is selected and the results are given below. Test the claim that the number of home team and visiting team losses is independent of the sport. Use
Football Basketball Soccer Baseball Home team losses 39 156 25 83 Visiting team losses 31 98 19 75
(Short Answer)
4.8/5 (40)
A company wants to determine if its employees have any preference among 5 different health plans which it offers to them. A sample of 200 employees provided the data below. Find the critical value to test the claim that the probabilities show no preference. Use .
Plan 1 2 3 4 5 Employees 65 30 18 55 32
(Multiple Choice)
4.8/5 (37)
As the number of the degrees of freedom increases, the distribution
(Multiple Choice)
5.0/5 (39)
A random sample of 160 car purchases are selected and categorized by age. The results are listed below. The age distribution of drivers for the given categories is for the under 26 group, for the group, for the group, and for the group over 65 . Find the critical value to test the claim that all ages have purchase rates proportional to their driving rates. Use .
Age Under 26 26-45 46-65 Over 65 Purchases 66 39 25 30
(Multiple Choice)
4.9/5 (33)
A company wants to determine if its employees have any preference among 5 different health plans which it offers to them. A sample of 200 employees provided the data below. Calculate the chi -square test statistic to test the claim that the probabilities show no preference. Use .
Plan 1 2 3 4 5 Employees 18 65 32 30 55
(Multiple Choice)
5.0/5 (40)
A company wants to determine if its employees have any preference among 5 different health plans which it offers to them. A sample of 200 employees provided the data below. Test the claim that the probabilities show no preference. Use .
Plan 1 2 3 4 5 Employees 30 65 18 32 55
(Short Answer)
4.7/5 (39)
Perform a Test for Independence
-The contingency table below shows the results of a random sample of 200 registered voters that was conducted to see whether their opinions on a bill are related to their party affiliation.
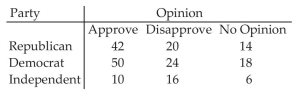 Test the claim of independence.
(Short Answer)
4.9/5 (36)
A spinner is mounted on a piece of cardboard divided into six areas of equal size. Each of the six areas is a different color (blue, yellow, red, green, white and orange). When the spinner is spun, each color should be selected by the spinner approximately of the time. A student suspects that a certain spinner is defective. The suspected spinner is spun 90 times. The results are shown below. Test the student's claim. Use .
Color Blue Yellow Red Green White Orange Frequency 11 12 16 15 19 17
(Short Answer)
4.9/5 (35)
A spinner is mounted on a piece of cardboard divided into six areas of equal size. Each of the six areas is a different color (blue, yellow, red, green, white and orange). When the spinner is spun, each color should be selected by the spinner approximately of the time. A student suspects that a certain spinner is defective. The suspected spinner is spun 90 times. The results are shown below. Calculate the chi-square test statistic to test the student's claim. Use .
Color Blue Yellow Red Green White Orange Frequency 17 11 12 19 15 16
(Multiple Choice)
4.9/5 (36)
Perform a Test for Independence
-In a test of independence, the null hypothesis is that
(Multiple Choice)
4.8/5 (32)
Perform a Test for Independence
-A sports statistician is interested in determining if there is a relationship between the number of home team and visiting team losses and different sports. A random sample of 526 games is selected and the results are given below. Calculate the chi-square test statistic to test the claim that the number of home team and visiting team losses is independent of the sport. Use .
Football Basketball Soccer Baseball Home team losses 39 156 25 83 Visiting team losses 31 98 19 75
(Multiple Choice)
4.9/5 (44)
Perform a Test for Independence
-A medical researcher is interested in determining if there is a relationship between adults over 50 who exercise regularly and low, moderate, and high blood pressure. A random sample of 236 adults over 50 is selected and the results are given below. Calculate the chi-square test statistic to test the claim that regular exercise and low, moderate, and high blood pressure are independent. Use .
Blood Pressure Low Moderate High Reg. Exercise 35 62 25 No Reg. Exercise 21 65 28
(Multiple Choice)
4.8/5 (33)
A teacher figures that final grades in the chemistry department are distributed as: D, F, . At the end of a randomly selected semester, the following number of grades were recorded. Find the critical value to determine if the grade distribution for the department is different than expected. Use
Grade A B C D F Number 42 36 60 14 8
(Multiple Choice)
4.9/5 (31)
A teacher figures that final grades in the chemistry department are distributed as: A, D, F, . At the end of a randomly selected semester, the following number of grades were recorded. Determine if the grade distribution for the department is different than expected. Use .
Grade A B C D F Number 42 36 60 8 14
(Short Answer)
4.8/5 (32)
A spinner is mounted on a piece of cardboard divided into six areas of equal size. Each of the six areas is a different color (blue, yellow, red, green, white and orange). When the spinner is spun, each color should be selected by the spinner approximately of the time. A student suspects that a certain spinner is defective. The suspected spinner is spun 90 times. The results are shown below. Find the critical value to test the student's claim. Use .
Color Blue Yellow Red Green White Orange Frequency 12 19 16 11 17 15
(Multiple Choice)
4.9/5 (41)
Many track hurdlers believe that they have a better chance of winning if they start in the inside lane that is closest to the field. For the data below, the lane closest to the field is Lane 1 , the next lane is Lane 2, and so on until the outermost lane, Lane 6. The data lists the number of wins for track hurdlers in the different starting positions. Calculate the chi-square test statistic to test the claim that the probabilities of winning are the same in the different positions. Use . The results are based on 240 wins.
Starting Position 1 2 3 4 5 6 Number of Wins 50 36 45 44 32 33
(Multiple Choice)
4.8/5 (36)
Perform a Test for Independence
-The data below show the age and favorite type of reading of 779 randomly selected people. Test the claim that age and preferred reading type are independent. Use .
Age Current Events Mystery Science Fiction History 15-21 21 45 90 33 21-30 68 55 42 48 30-40 65 47 31 57 40-50 60 39 25 53
(Short Answer)
4.9/5 (31)
Filters
- Essay(0)
- Multiple Choice(0)
- Short Answer(0)
- True False(0)
- Matching(0)