Exam 26: Multifactor Analysis of Variance
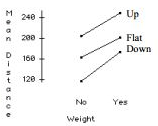
A student wants to build a paper airplane that gets maximum flight distance. She tries three ways of bending the wing (down, flat, and ) and two levels of nose weight (no and yes-a paper clip). She randomizes the 12 runs (each condition replicated twice). The analysis of variance for the 12 runs is shown in the table below along with an interaction
plot and tables of the mean distance for the different on
wing bends and weights.
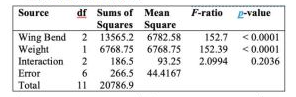
 Source df Sums of Squares Mean Square F-ratio P-value Wing Bend 2 13565.2 6782.58 152.7 <0.0001 Weight 1 6768.75 6768.75 152.39 <0.0001 Interaction 2 186.5 93.25 2.0994 0.2036 Error 6 266.5 44.4167 Total 11 20786.9
Wing Bend Expected Mean Down 145.0 Flat 182.5 Up 227.2
Weight Expected Mean No 161.2 Yes 208.7
a.Write the hypotheses tested by the Detergent F-ratio.Test the hypotheses and explain
b.Write the hypotheses tested by the Temp F-ratio.Test the
Source df Sums of Squares Mean Square F-ratio P-value Wing Bend 2 13565.2 6782.58 152.7 <0.0001 Weight 1 6768.75 6768.75 152.39 <0.0001 Interaction 2 186.5 93.25 2.0994 0.2036 Error 6 266.5 44.4167 Total 11 20786.9
Wing Bend Expected Mean Down 145.0 Flat 182.5 Up 227.2
Weight Expected Mean No 161.2 Yes 208.7
a.Write the hypotheses tested by the Detergent F-ratio.Test the hypotheses and explain
b.Write the hypotheses tested by the Temp F-ratio.Test the
A student wants to build a paper airplane that gets maximum flight distance. She tries three ways of bending the wing (down, Alat, and up) and two levels of nose weight (no and yes-a paper clip). She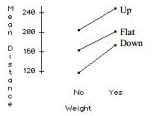
a. Does an additive model seem adequate? Explain.
An additive model seems adequate. The povalue for the interaction term in the ANOVA table is large and the interaction plot shows nearly parallel lines.
b. Write a report on this analysis of the data. Include any recommendations you would give the student on designing the plane.
To get the maximum distance, the student should build a paper airplane with wings bent up and with a paper clip on the nose. The ANOVA table shows that both wing bend and nose weight are associated with the distance the plane flies. The tables of expected means shors that wing bend "up" has the highest average distance among the three wing configurations and that a weight on the nose has a higher mean distance than no weight.
For a class project, students tested four different brands of laundry detergent (1, 2, 3, 4) in
three different water temperatures (hot, warm, cold) to see whether there were any
differences in how well the detergents could clean clothes.The students took 36 identical
pieces of cloth and made them dirty by staining them with coffee, dirt, and grass.The 36
pieces were randomly assigned to the 12 combinations of detergent and temperature so
that each combination had 3 replicates.After washing, the students rated how clean the
clothes were from 0 (no change) to 20 (completely spotless).The two factor ANOVA
table is shown below along with an interaction plot and residual plots. 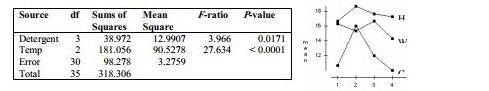 a. Write the hypotheses tested by the Detergent -ratio. Test the hypotheses and explain your conclusion in the context of the problem.
 b. Write the hypotheses tested by the Temp -ratio. Test the hypotheses and explain your conclusion in the context of the problem.
 c. Check the conditions required for the ANOVA analysis.
For a class project, students tested four different brands of laundry detergent (1, 2, 3, 4)
in three different water temperatures (hot, warm, cold) to see whether there were any
differences in how well the detergents could clean clothes. The students took 36 identical
pieces of cloth and made them dirty by staining them with coffee, dirt, and grass. The 36
pieces were randomly assigned to the 12 combinations of detergent and temperature so
that each combination had 3 replicates. After washing, the students rated how clean the
clothes were from 0 (no change) to 20 (completely spotless). The two factor ANOVA
table is shown below along with an interaction plot and residual plots.
table is shown below along with an interaction plot and residual plots. 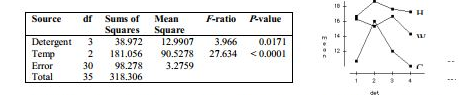
a. Write the hypotheses tested by the Detergent -ratio. Test the hypotheses and explain your conclusion in the context of the problem. hypotheses and explain your conclusion in the context of the problem.
. Each temperature has an equal effect on the how clean the clothes are.
: At least one temperature has a different effect than the others.
There is strong evidence that the temperatures do not clean equally well.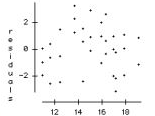
b.Write the hypotheses tested by the Temp -ratio. Test the hypotheses and explain your conclusion in the context of the problem.
. Each temperature has an equal effect on the how clean the clothes are.
: At least one temperature has a different effect than the others.
There is strong evidence that the temperatures do not clean equally well.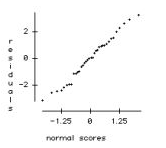
c. Check the conditions required for the ANOVA analysis.
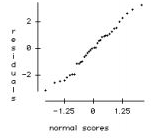
normal secres.
* Randomization: OK. The treatments were applied to the clothes in a random order.
* Additive enough: Violated. The lines in the interaction plot are not parallel. It seems that Detergent 2 cleans much better than expected in cold water. Add an interaction term.
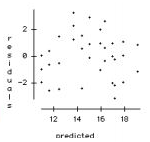
* Similar variance: Caution. The residual vs. predicted plot shows slightly uneven spread.
However, the differences observed are so strong that should not affect our conclusions.
* Nearly normal: OK. The normal probability plot is straight.
Filters
- Essay(0)
- Multiple Choice(0)
- Short Answer(0)
- True False(0)
- Matching(0)