Exam 2: Displaying and Describing Data
Exam 1: Stats Starts Here16 Questions
Exam 2: Displaying and Describing Data16 Questions
Exam 3: Relationships Between Categorical Variablescontingency Tables19 Questions
Exam 4: Understanding and Comparing Distributions16 Questions
Exam 5: The Standard Deviation As a Ruler and the Normal Model18 Questions
Exam 6: Scatterplots, Association, and Correlation19 Questions
Exam 7: Linear Regression18 Questions
Exam 8: Regression Wisdom17 Questions
Exam 9: Multiple Regression16 Questions
Exam 10: Sample Surveys19 Questions
Exam 11: Experiments and Observational Studies17 Questions
Exam 12: From Randomness to Probability2 Questions
Exam 13: Probability Rules5 Questions
Exam 14: Random Variables6 Questions
Exam 15: Probability Models6 Questions
Exam 17: Confidence Intervals for Means17 Questions
Exam 18: Testing Hypotheses17 Questions
Exam 19: More About Tests and Intervals17 Questions
Exam 20: Comparing Groups18 Questions
Exam 21: Paired Samples and Blocks15 Questions
Exam 22: Comparing Counts17 Questions
Exam 23: Inferences for Regression16 Questions
Exam 26: Multifactor Analysis of Variance2 Questions
Select questions type
A restaurant uses comment cards to get feedback from its customers about newly added items to the menu.It recently introduced homemade organic veggie burgers.Customers who tried
The new burger were asked if they would order it again.The data are summarized in the table
Below.What percentage of customers would most likely or definitely order the veggie burger
Again?
Free
(Multiple Choice)
4.8/5  (30)
(30)
Correct Answer: Verified
E
A clothing store uses comment cards to get feedback from its customers about newly added items.It recently introduced plus size fashion wear.Customers who purchased the items
Were asked to fill out an online comment survey giving 10% off the next purchase.The data
Are summarized in the table below.What percentage of customers were at least satisfied with
The item(s) purchased (Satisfied or Very satisfied)? Response Frequency Very satisfied. 15 Satisfied. 30 Less than fully satisfied. 12 Not satisfied. 4
Free
(Multiple Choice)
4.9/5 (32)
Correct Answer:Verified
B
A automobile marketing firm conducts a study to see what types of cars people owned before buying an American car.The results are shown below. Previous Ownership Frequency American 760 Japanese 375 Korean 72 German 37 Other 24 Total The relative frequency of those who owned Japanese cars previously who now bought
American cars is
Free
(Multiple Choice)
4.8/5 (36)
Correct Answer:Verified
B
Consider the five number summary of hourly wages ($) for a sample of sales managers. Suppose the mean hourly wage is $38.50.What can we say about the shape of the
Distribution? Min Q1 Median Q3 Max 20.94 37.64 44.77 49.34 67.11
(Multiple Choice)
4.9/5 (40)
A restaurant uses comment cards to get feedback from its customers about newly added items to the menu.It recently introduced homemade organic veggie burgers.Customers who tried
The new burger were asked if they would order it again.The data are summarized in the table
Below.What percentage of customers would definitely order the veggie burger again? Response Frequency Definitely would. 10 Most likely would. 40 Maybe 12 Definitely would not. 3
(Multiple Choice)
4.8/5 (38)
The following table shows representative recent closing share prices for a small sample of companies based in India in January 2019. COMPANY CLOSING SHARE PRICE 20 Microns 42.00 Kuantum Papers 467.95 Bank of MA 14.65 Photoquip 35.65 Saksoft 284.35 Marg LTD 15.10 Galaxy ENT 29.15 Sonatasoft 305.00 EDynamics 0.67 DB Corp. 179.00 The standard deviation in closing share prices is
(Multiple Choice)
4.8/5 (33)
Consider the five number summary of hourly wages ($) for a sample of advertising / promotion managers. Min Q1 Median Q3 Max 19.64 29.36 34.18 40.86 57.26 Suppose there had been an error and that the lowest hourly wage was $15.50 instead of
$19)64.This would result in
(Multiple Choice)
4.8/5 (39)
Consider the five number summary of hourly wages ($) for a sample of sales managers. Min Q1 Median Q3 Max 20.94 37.64 44.77 49.34 67.11 The range for these data is
(Multiple Choice)
4.9/5 (40)
The following table shows data for total assets ($ billion) for a small sample of U.S.banks (4th quarter 2018). 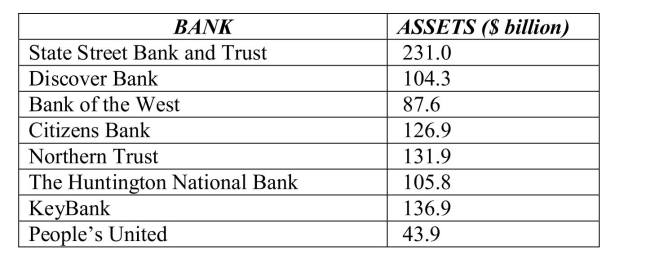 The mean for the total assets data ($ billion) is
(Multiple Choice)
4.7/5 (36)
Consider the five number summary of hourly wages ($) for a sample of sales managers. Min Q1 Median Q3 Max 20.94 37.64 44.77 49.34 67.11 The IQR for these data is
(Multiple Choice)
4.9/5 (39)
Below is a histogram of salaries (in $) for a sample of U.S.marketing managers. 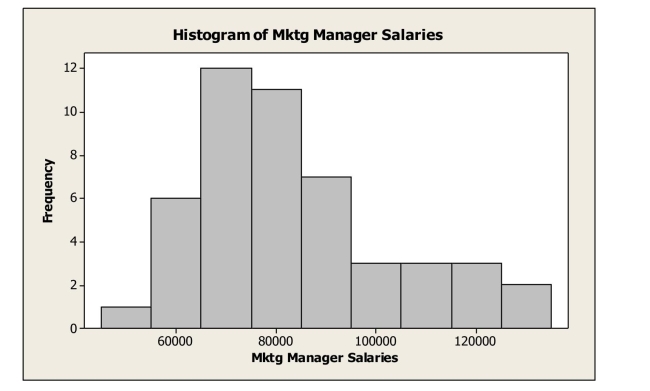 The shape of this distribution is
(Multiple Choice)
4.8/5 (39)
A clothing store uses comment cards to get feedback from its customers about newly added items.It recently introduced plus size fashion wear.Customers who purchased the items
Were asked to fill out an online comment survey giving 10% off the next purchase.The data
Are summarized in the table below.What percentage of customers were less than fully
Satisfied?
(Multiple Choice)
4.9/5 (30)
The following table shows total assets ($ billion) for a small sample of U.S.banks in the 4th quarter of 2018. 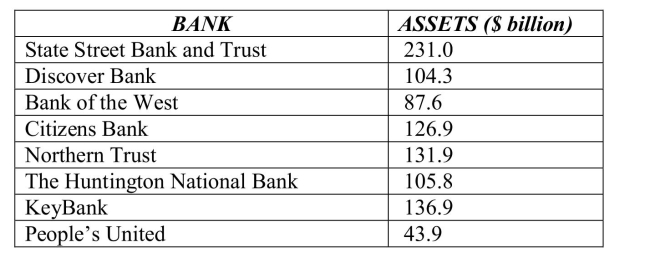 The standard deviation for these data is
(Multiple Choice)
4.7/5 (33)
Below is a histogram of salaries (in $) for a sample of U.S.marketing managers. 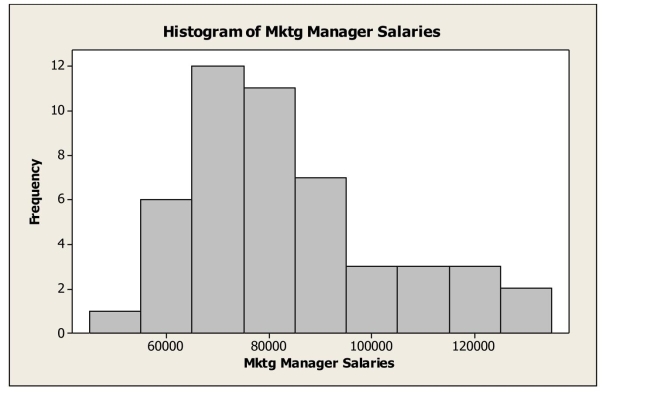 The most appropriate measure of central tendency for these data is the
(Multiple Choice)
4.7/5 (34)
Here is the five number summary for salaries of U.S.marketing managers. The IQR is Min Q1 Median Q3 Max 46360 69693 77020 91750 129420
(Multiple Choice)
4.9/5 (37)
The following table shows representative recent closing share prices for a small sample of companies based in India in January 2019. COMPANY CLOSING SHARE PRICE 20 Microns 42.00 Kuantum Papers 467.95 Bank of MA 14.65 Photoquip 35.65 Saksoft 284.35 Marg LTD 15.10 Galaxy ENT 29.15 Sonatasoft 305.00 EDynamics 0.67 DB Corp. 179.00 The mean closing share prices is
(Multiple Choice)
4.8/5 (37)
Filters
- Essay(0)
- Multiple Choice(0)
- Short Answer(0)
- True False(0)
- Matching(0)