Exam 7: Linear Regression
Exam 1: Stats Starts Here16 Questions
Exam 2: Displaying and Describing Data16 Questions
Exam 3: Relationships Between Categorical Variablescontingency Tables19 Questions
Exam 4: Understanding and Comparing Distributions16 Questions
Exam 5: The Standard Deviation As a Ruler and the Normal Model18 Questions
Exam 6: Scatterplots, Association, and Correlation19 Questions
Exam 7: Linear Regression18 Questions
Exam 8: Regression Wisdom17 Questions
Exam 9: Multiple Regression16 Questions
Exam 10: Sample Surveys19 Questions
Exam 11: Experiments and Observational Studies17 Questions
Exam 12: From Randomness to Probability2 Questions
Exam 13: Probability Rules5 Questions
Exam 14: Random Variables6 Questions
Exam 15: Probability Models6 Questions
Exam 17: Confidence Intervals for Means17 Questions
Exam 18: Testing Hypotheses17 Questions
Exam 19: More About Tests and Intervals17 Questions
Exam 20: Comparing Groups18 Questions
Exam 21: Paired Samples and Blocks15 Questions
Exam 22: Comparing Counts17 Questions
Exam 23: Inferences for Regression16 Questions
Exam 26: Multifactor Analysis of Variance2 Questions
Select questions type
A regression analysis of students' college grade point averages (GPAs) and their high school GPAs found . Which of these is true?
I. High school GPA accounts for of college GPA.
II. of college GPAs can be correctly predicted with this model.
III. of the variance in college GPA can be accounted for by the model
Free
(Multiple Choice)
4.8/5  (39)
(39)
Correct Answer: Verified
C
A company studying the productivity of its employees on a new information system was interested in determining if the age of data entry operators influenced the number of completed entries made per hour (Y). The regression equation is . Suppose the actual completed entries per hour for an operator who is 35 years old was 8 . The residual is
Free
(Multiple Choice)
4.9/5 (36)
Correct Answer:Verified
A
A company studying the productivity of their employees on a new information system was interested in determining if the age of data entry operators influenced the number of completed entries made per hour (Y). The regression equation is . If and , then the correlation coefficient between age and productivity is
Free
(Multiple Choice)
4.8/5 (36)
Correct Answer:Verified
E
A small independent organic food store offers a variety of specialty coffees.To determine whether price has an impact on sales, the managers kept track of how many pounds of each
Variety of coffee were sold last month. PRICE PER POUND POUNDS SOLD \ 3.99 75 \ 5.99 60 \ 7.00 65 \ 12.00 45 \ 4.50 80 \ 7.50 70 \ 15.00 25 \ 10.00 35 \ 12.50 40 Mean \ 8.99 50 Standard Deviation \ 3.63 54.50 18.33 Based on the data and summary statistics shown below, the slope of the estimated regression
Line that relates the response variable (monthly sales) to the predictor variable (price per
Pound) is
(Multiple Choice)
4.9/5 (37)
A small independent organic food store offers a variety of specialty coffees.To determine whether price has an impact on sales, the managers kept track of how many pounds of each
Variety of coffee were sold last month. PRICE PER POUND POUNDS SOLD \ 3.99 75 \ 5.99 60 \ 7.00 65 \ 12.00 45 \ 4.50 80 \ 7.50 70 \ 15.00 25 \ 10.00 35 \ 12.50 40 \ 8.99 50 Mean Ctandard \ 8.75 54.50 Deviation 18.33 Based on the data and summary statistics, the intercept of the estimated regression line that
Relates the response variable (monthly sales) to the predictor variable (price per pound) is
(Multiple Choice)
4.8/5 (34)
A small independent organic food store offers a variety of specialty coffees.To determine whether price has an impact on sales, the managers kept track of how many pounds of each
Variety of coffee were sold last month. PRICE PER POUND POUNDS SOLD Mean \ 8.75 54.50 Standard Deviation \ 3.63 18.33 Correlation - Based on the summary statistics shown below, what percent of the variability in the number
Of pounds of coffee sold per week can be explained by price?
(Multiple Choice)
4.7/5 (40)
If the point in the upper left corner of the scatterplot is removed, what will happen to the correlation (r) and the slope of the line of best fit (b)? 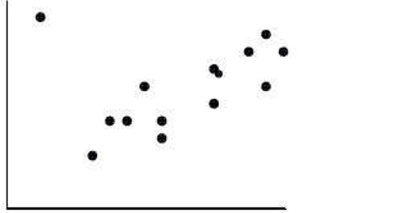
(Multiple Choice)
4.9/5 (43)
The correlation coefficient between high school grade point average (GPA) and college GPA is 0.560.For a student with a high school GPA that is 2.5 standard deviations above the
Mean, we would expect that student to have a college GPA that is ______ the mean.
(Multiple Choice)
4.9/5 (34)
It' s easy to measure the circumference of a tree' s trunk, but not so easy to measure its height. Foresters developed a model for ponderosa pines that they use to predict the tree' height (in feet) from the circumference of its trunk (in inches): ). A lumberjack finds a tree with a circumference of ; how tall does this model estimate the tree to be?
(Multiple Choice)
5.0/5 (47)
Data were collected on monthly sales revenues (in ) and monthly advertising expenditures s) for a sample of drug stores. The regression line relating revenues (Y) to advertising expenditure is estimated to be . The predicted sales revenue for a month in which was spent on advertising is
(Multiple Choice)
4.9/5 (39)
Suppose the correlation, r, between two variables x and y is -0.44.What percentage of the variability in y cannot be explained by x?
(Multiple Choice)
4.8/5 (35)
Suppose the correlation, r, between two variables x and y is -0.44.What would you predict about a y value if the x value is 2 standard deviations above its mean?
(Multiple Choice)
4.8/5 (36)
Data were collected on monthly sales revenues (in ) and monthly advertising expenditures for a sample of drug stores. The regression line relating revenues to advertising expenditure is estimated to be . The correct interpretation of the slope is that for each additional
(Multiple Choice)
4.7/5 (34)
An 8th grade class develops a linear model that predicts the number of cheerios (a small round cereal) that fit on the circumference of a plate by using the diameter in inches.Their
Model is cheerios = 0.56 + 5.11(diameter).
If the diameter is increased from 4 inches to 14 inches, the predicted number of cheerios will
Increase by about…
(Multiple Choice)
4.8/5 (42)
An 8th grade class develops a linear model that predicts the number of cheerios (a small round cereal) that fit on the circumference of a plate by using the diameter in inches.Their
Model is cheerios = 0.56 + 5.11(diameter).
The slope of this model is best interpreted in context as…
(Multiple Choice)
4.8/5 (39)
If the point in the upper right corner of this scatterplot is removed from the data set, then what will happen to the slope of the line of best fit (b) and to the correlation (r)? 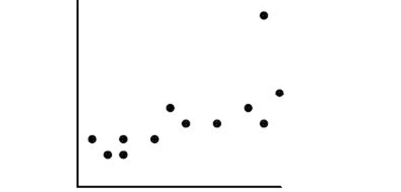
(Multiple Choice)
5.0/5 (36)
Filters
- Essay(0)
- Multiple Choice(0)
- Short Answer(0)
- True False(0)
- Matching(0)