Exam 12: From Randomness to Probability
Exam 1: Stats Starts Here16 Questions
Exam 2: Displaying and Describing Data16 Questions
Exam 3: Relationships Between Categorical Variablescontingency Tables19 Questions
Exam 4: Understanding and Comparing Distributions16 Questions
Exam 5: The Standard Deviation As a Ruler and the Normal Model18 Questions
Exam 6: Scatterplots, Association, and Correlation19 Questions
Exam 7: Linear Regression18 Questions
Exam 8: Regression Wisdom17 Questions
Exam 9: Multiple Regression16 Questions
Exam 10: Sample Surveys19 Questions
Exam 11: Experiments and Observational Studies17 Questions
Exam 12: From Randomness to Probability2 Questions
Exam 13: Probability Rules5 Questions
Exam 14: Random Variables6 Questions
Exam 15: Probability Models6 Questions
Exam 17: Confidence Intervals for Means17 Questions
Exam 18: Testing Hypotheses17 Questions
Exam 19: More About Tests and Intervals17 Questions
Exam 20: Comparing Groups18 Questions
Exam 21: Paired Samples and Blocks15 Questions
Exam 22: Comparing Counts17 Questions
Exam 23: Inferences for Regression16 Questions
Exam 26: Multifactor Analysis of Variance2 Questions
Select questions type
A survey of families revealed that 58% of all families eat turkey at holiday meals, 44% eat
ham, and 16% have both turkey and ham to eat at holiday meals.
a.What is the probability that a family selected at random had neither turkey nor ham at
their holiday meal?
b.What is the probability that a family selected at random had only ham without having
turkey at their holiday meal?
c.What is the probability that a randomly selected family having turkey had ham at their
holiday meal?
d.Are having turkey and having ham disjoint events? Explain.
Free
(Essay)
4.8/5  (34)
(34)
Correct Answer: Verified
a.
Or, using the Venn diagram at the right,
b.
Or, using Venn Diagram at the right, .
c. ham turkey ![a. \begin{array} { l } P ( \text { neither ham nor turkey } ) \\ = 1 - P ( \text { ham } \cup \text { turkey } ) \\ = 1 - [ P ( \text { ham } ) + P ( \text { turkey } ) - P ( \text { ham } \cap \text { turkey } ) ] \\ = 1 - [ 0.44 + 0.58 - 0.16 ] = 1 - 0.86 = 0.14 \end{array} Or, using the Venn diagram at the right, 14 \% b. \begin{aligned} P ( \text { ham only } ) & = P ( \text { ham } ) - P ( \text { ham } \cap \text { turkey } ) \\ & = 0.44 - 0.16 \\ & = 0.28 \end{aligned} Or, using Venn Diagram at the right, 28 \% . c. \quad P ( ham \mid turkey ) = \frac { P ( \text { ham } \cap \text { turkey } ) } { P ( \text { turkey } ) } = \frac { 0.16 } { 0.58 } = 0.2759 d.No, the events are not disjoint, since some families (16%) have both ham and turkey at their holiday meals.](https://storage.examlex.com/TB7192/11eb4928_20e9_ba6a_b114_41d715283db5_TB7192_00.jpg) d.No, the events are not disjoint, since some families (16%) have both ham and turkey at
d.No, the events are not disjoint, since some families (16%) have both ham and turkey at
their holiday meals.
Many school administrators watch enrollment numbers for answers to questions parents ask.
Some parents wondered if preferring a particular science course is related to the student's
preference in foreign language.Students were surveyed to establish their preference in
science and foreign language courses.Does it appear that preferences in science and foreign
language are independent? Explain. 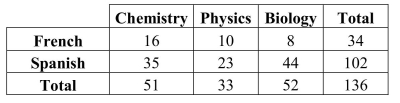
Free
(Essay)
4.8/5 (37)
Correct Answer:Verified
Overall, 102 of 136, or 75%, preferred Spanish.35 of 51, or 68.6%, of students in Chemistry
had Spanish.23 of 33, or 69.6%, of students in Physics had Spanish, and 44 of 52, or 84.6%
of students in Biology had Spanish.Chemistry and Physics students were somewhat less
likely to take Spanish than Biology students.It appears that there is an association between
preference in science and foreign language.
Filters
- Essay(0)
- Multiple Choice(0)
- Short Answer(0)
- True False(0)
- Matching(0)