Exam 4: Understanding and Comparing Distributions
Exam 1: Stats Starts Here16 Questions
Exam 2: Displaying and Describing Data16 Questions
Exam 3: Relationships Between Categorical Variablescontingency Tables19 Questions
Exam 4: Understanding and Comparing Distributions16 Questions
Exam 5: The Standard Deviation As a Ruler and the Normal Model18 Questions
Exam 6: Scatterplots, Association, and Correlation19 Questions
Exam 7: Linear Regression18 Questions
Exam 8: Regression Wisdom17 Questions
Exam 9: Multiple Regression16 Questions
Exam 10: Sample Surveys19 Questions
Exam 11: Experiments and Observational Studies17 Questions
Exam 12: From Randomness to Probability2 Questions
Exam 13: Probability Rules5 Questions
Exam 14: Random Variables6 Questions
Exam 15: Probability Models6 Questions
Exam 17: Confidence Intervals for Means17 Questions
Exam 18: Testing Hypotheses17 Questions
Exam 19: More About Tests and Intervals17 Questions
Exam 20: Comparing Groups18 Questions
Exam 21: Paired Samples and Blocks15 Questions
Exam 22: Comparing Counts17 Questions
Exam 23: Inferences for Regression16 Questions
Exam 26: Multifactor Analysis of Variance2 Questions
Select questions type
The boxplots show prices of used cars (in thousands of dollars) advertised for sale at three different car dealers.Which dealer offers the cheapest car offered, and at what price? 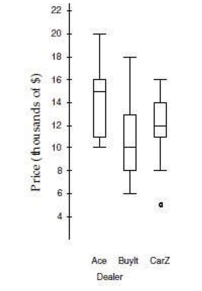
Free
(Multiple Choice)
4.9/5  (34)
(34)
Correct Answer: Verified
A
At www.census.gov you can create a "population pyramid" for any country.These pyramids are back-to-back histograms.This pyramid shows Mexico's 2000 female population and the
Census bureau's projection for 2050.Check all that apply. 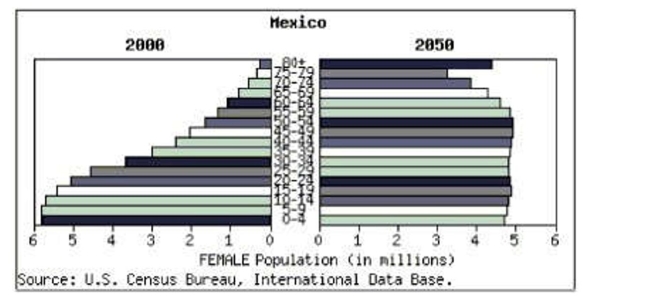
Free
(Multiple Choice)
4.8/5 (33)
Correct Answer:Verified
A, B, E
One thousand students from a local university were sampled to gather information such as gender, high school GPA, college GPA, and total SAT scores.The results were used to create
Histograms displaying high school grade point averages (GPAs) for both males and females.
Compare the grade distribution of males and females.Check all that apply. 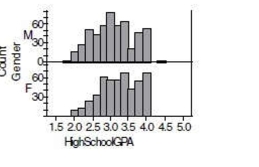
Free
(Multiple Choice)
4.8/5 (33)
Correct Answer:Verified
A, B, E
The side-by-side boxplots show the cumulative college GPAs for sophomores, juniors, and seniors taking an intro stats course in Autumn 2003. 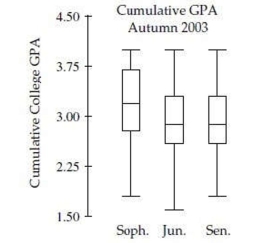 Which class has the most skewed set of GPAs?
(Multiple Choice)
5.0/5 (44)
The boxplots show prices of used cars (in thousands of dollars) advertised for sale at three different car dealers.Which dealer has the lowest median price, and how much is it?
(Multiple Choice)
4.7/5 (40)
The side-by-side boxplots show the cumulative college GPAs for sophomores, juniors, and seniors taking an intro stats course in Autumn 2003. 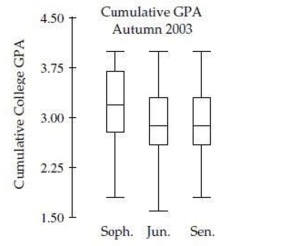 What is the approximate value of that GPA of the lowest scoring student?
(Multiple Choice)
4.8/5 (40)
The side-by-side boxplots show the cumulative college GPAs for sophomores, juniors, and seniors taking an intro stats course in Autumn 2003. 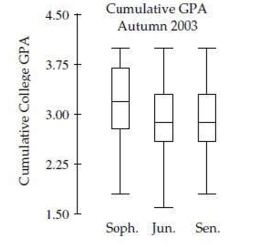 What is the approximate value of the largest range for GPA?
(Multiple Choice)
4.8/5 (30)
The following boxplots show monthly sales revenue figures ($ thousands) for a discount office supply company with locations in three different regions of the U.S.(Northeast,
Southeast, and West).Which of the following statements is false? 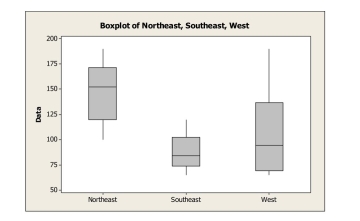
(Multiple Choice)
4.8/5 (38)
The boxplots show prices of used cars (in thousands of dollars) advertised for sale at three different car dealers.Which dealer has the smallest price range, and what is it? 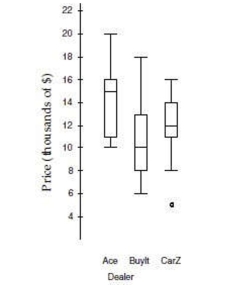
(Multiple Choice)
4.8/5 (29)
The following boxplots show monthly sales revenue figures ($ thousands) for a discount office supply company with locations in three different regions of the U.S.(Northeast,
Southeast, and West).Which of the following statements is true? 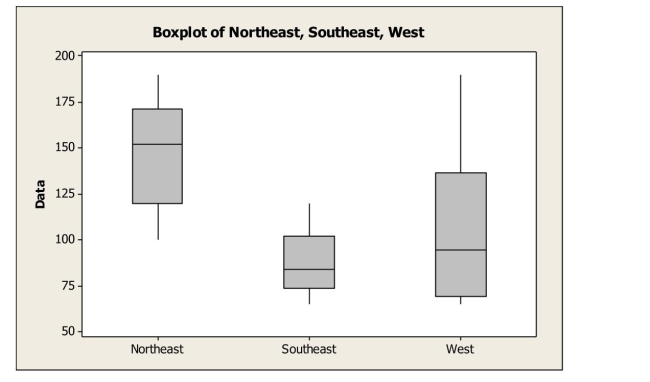
(Multiple Choice)
4.7/5 (35)
At www.census.gov you can create a "population pyramid" for any country.These pyramids are back-to-back histograms.This pyramid shows Mexico's 2000 female population and the
Census bureau's projection for 2050.Check all that apply. 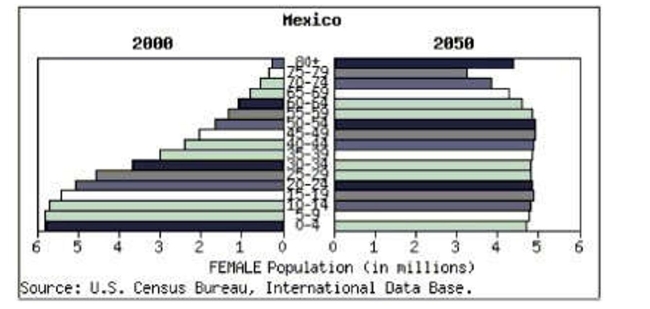
(Multiple Choice)
4.8/5 (29)
The side-by-side boxplots show the cumulative college GPAs for sophomores, juniors, and seniors taking an intro stats course in Autumn 2003. 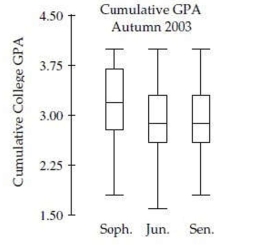 What is approximately the GPA of the class with the highest median GPA?
(Multiple Choice)
4.8/5 (34)
The side-by-side boxplots show the cumulative college GPAs for sophomores, juniors, and seniors taking an intro stats course in Autumn 2003. 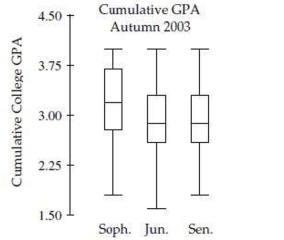 Which class has the highest median GPA?
(Multiple Choice)
4.9/5 (35)
How do sports salaries compare? Two sets of histograms below show the distributions of salaries for Major League Baseball and the National Football League.What set of histograms
Makes it easier to compare the distributions? And for what reasons? Check all that apply. 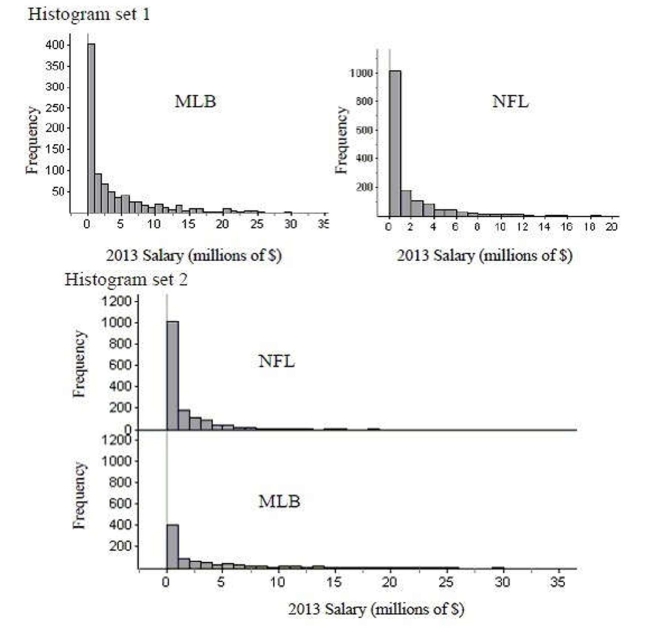
(Multiple Choice)
4.8/5 (40)
The side-by-side boxplots show the cumulative college GPAs for sophomores, juniors, and seniors taking an intro stats course in Autumn 2003. 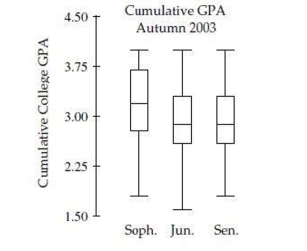 Which class has the largest range for GPA?
(Multiple Choice)
4.9/5 (34)
The boxplots show prices of used cars (in thousands of dollars) advertised for sale at three different car dealers.Which dealer's prices have the smallest IQR, and what is it? 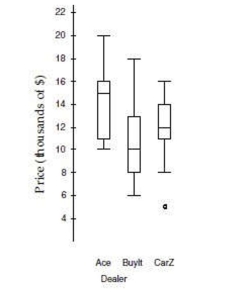
(Multiple Choice)
4.9/5 (30)
Filters
- Essay(0)
- Multiple Choice(0)
- Short Answer(0)
- True False(0)
- Matching(0)