Exam 3: Numerical Summaries of Data
Exam 1: Basic Ideas39 Questions
Exam 2: Graphical Summaries of Data40 Questions
Exam 3: Numerical Summaries of Data76 Questions
Exam 4: Summarizing Bivariate Data33 Questions
Exam 5: Probability99 Questions
Exam 6: Discrete Probability Distributions76 Questions
Exam 7: The Normal Distribution131 Questions
Exam 8: Confidence Intervals62 Questions
Exam 9: Hypothesis Testing115 Questions
Exam 10: Two-Sample Confidence Intervals44 Questions
Exam 11: Two-Sample Hypothesis Tests43 Questions
Exam 12: Tests With Qualitative Data26 Questions
Exam 13: Inference in Linear Models51 Questions
Exam 14: Analysis of Variance48 Questions
Exam 15: Nonparametric Statistics27 Questions
Select questions type
Find the median for the following data set: 28 33 14 29 24 14
(Multiple Choice)
4.7/5  (37)
(37)
The completion times for a certain marathon race was 2.4 hours with a standard deviation of 0.5 hours. What can you determine about these data by using Chebyshev's Inequality with K = 2?
(Multiple Choice)
4.8/5 (33)
A data set has a mean of 157 and a standard deviation of 20. Compute the coefficient of variation.
(Multiple Choice)
4.7/5 (39)
For the data set below, find the third quartile. 166 168 177 181 186 188 194 201 209 251
(Multiple Choice)
5.0/5 (42)
The table below lists the populations, in thousands, of several rural western counties. What is the mean population?
County Population (thousands) Aldridge 28 Cleveland 22 McCarthy 11 Pope 16 Sorrell 26 Wilson 21
(Multiple Choice)
4.9/5 (40)
In Steve's statistics class, the final grade is a weighted mean of a homework grade, three midterm grades, and a final exam grade. The homework counts for 15% of the grade, each midterm counts For 15%, and the final exam counts for 40%. Steve got an average score of 60 on the homework, 80, 70, and 75 on the midterms, and 75 on the final. What is Steve's final grade?
(Multiple Choice)
4.8/5 (38)
Approximate the population variance given the following frequency distribution.
Class Frequency 0-14 12 15-29 16 30-44 15 45-59 9 60-74 11
(Multiple Choice)
4.9/5 (40)
Find the median for the following data set: 13 23 11 26 22 18
(Multiple Choice)
4.9/5 (43)
The following tables present the number of specimens that tested positive for Type A and Type B influenza in the United States during the first 15 weeks of a recent flu season.
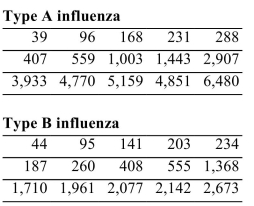 Find the median number of type A and type B cases in the first 15 weeks of the flu season.
(Multiple Choice)
4.9/5 (40)
For the data set below, find the third quartile.
70 70 76 66 76 75 61 67 60 71 74
(Multiple Choice)
4.9/5 (33)
A soft-drink bottling company fills and ships soda in plastic bottles with a target volume of 354 milliliters. The filling machinery does not deliver a perfectly consistent volume of liquid to each Bottle, and the three quartiles for the fill volume are Find the IQR.
(Multiple Choice)
4.9/5 (35)
Find the mean for the following data set: 21 13 15 24 29 13
(Multiple Choice)
4.8/5 (30)
Use the given frequency distribution to approximate the mean.
Class Frequency 0-19 19 20-39 17 40-59 12 60-79 12 80-99 19
(Multiple Choice)
4.8/5 (45)
Construct a boxplot for the data set below.
95 95 95 97 90 89 90 85 91 84 89 91 92 89 89 89 88 89 91 90
(Multiple Choice)
4.8/5 (34)
Filters
- Essay(0)
- Multiple Choice(0)
- Short Answer(0)
- True False(0)
- Matching(0)