Exam 3: Numerical Summaries of Data
Exam 1: Basic Ideas39 Questions
Exam 2: Graphical Summaries of Data40 Questions
Exam 3: Numerical Summaries of Data76 Questions
Exam 4: Summarizing Bivariate Data33 Questions
Exam 5: Probability99 Questions
Exam 6: Discrete Probability Distributions76 Questions
Exam 7: The Normal Distribution131 Questions
Exam 8: Confidence Intervals62 Questions
Exam 9: Hypothesis Testing115 Questions
Exam 10: Two-Sample Confidence Intervals44 Questions
Exam 11: Two-Sample Hypothesis Tests43 Questions
Exam 12: Tests With Qualitative Data26 Questions
Exam 13: Inference in Linear Models51 Questions
Exam 14: Analysis of Variance48 Questions
Exam 15: Nonparametric Statistics27 Questions
Select questions type
Following are heights, in inches, for a sample of college basketball players. 70 78 70 75 75 72 76 85 88 84 84 71 85 81 78 88 71 70 76 88 Find the sample standard deviation for the heights of the basketball players.
(Multiple Choice)
4.8/5  (35)
(35)
The following tables present the number of specimens that tested positive for Type A and Type B influenza in the United States during the first 15 weeks of a recent flu season.
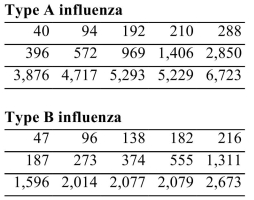 Find the mean number of type A and type B cases in the first 15 weeks of the flu season.
(Multiple Choice)
4.9/5 (35)
A survey found that the median number of calories consumed per day in a certain country was 3,304 and the mean was 3,204.9 calories. If a histogram were constructed for the data, would you expect it To be skewed to the right, to the left, or approximately symmetric?
(Multiple Choice)
4.9/5 (46)
For the data set below, find the IQR. 71 69 62 79 64 79 63 66 72 74 65
(Multiple Choice)
4.8/5 (26)
Approximate the population standard deviation given the following frequency distribution.
Class Frequency 0-14 15 15-29 9 30-44 8 45-59 8 60-74 13
(Multiple Choice)
4.7/5 (40)
A data set has a median of 63, and six of the numbers in the data set are less than median. The data set contains a total of n numbers.
If n is even, and none of the numbers in the data set are equal to 63, what is the value of n?
(Multiple Choice)
4.9/5 (39)
Find the population variance for the following data set: 27 13 28 32 20
(Multiple Choice)
4.9/5 (34)
A population has a mean μ = 46 and standard deviation Find the z-score for a population value of 13.
(Multiple Choice)
4.8/5 (45)
A botany student measured the lengths of a sample of leaves to the nearest centimeter. The data is shown in the frequency distribution below. Use the data to approximate the mean to the nearest Tenth of a centimeter.
Length Frequency 0-5 4 6-11 7 12-17 13 18-23 18 24-29 8 30-35 5
(Multiple Choice)
4.9/5 (37)
For the data set below, find the first quartile.
72 79 62 76 77 60 65 75 76 67 67
(Multiple Choice)
4.9/5 (36)
Find the mode of the data in the following stem-and-leaf plot. The leaf represents the ones digit.
0 157 1 03448 2 68
(Multiple Choice)
4.7/5 (37)
The following data represent the total price, in dollars, of 20 randomly-selected gasoline purchases at a certain convenience store. 37.43 35.64 40.49 38.41 32.38 39.27 40.79 42.89 33.94 13.69 48.73 49.03 34.75 47.04 34.61 40.11 43.52 45.16 11.63 26.90 Find the median price for these purchases.
(Multiple Choice)
4.8/5 (24)
The following population parameters were obtained from a graphing calculator. 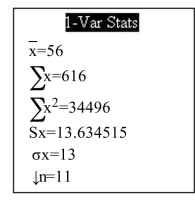 Assuming the population is bell-shaped, between what two values will approximately 95% of the population be?
(Multiple Choice)
4.8/5 (41)
A report states that the mean household income last year for a certain rural county was $46,200 and the median was $37,800. If a histogram were constructed for the incomes of all households in the County, would you expect it to be skewed to the right, to the left, or approximately symmetric?
(Multiple Choice)
4.9/5 (35)
Gina and Stewart are surf-fishing on the Atlantic coast, where both bluefish and pompano are common catches. The mean length of a bluefish is 285 millimeters with a standard deviation of 54 mm. For pompano, the mean is 128 mm with a standard deviation of 24 mm.
Stewart caught a bluefish that was 313 mm long. What was the z-score for this length?
(Multiple Choice)
4.9/5 (35)
Find the median of the data in the following stem-and-leaf plot. The leaf represents the ones digit.
1 7 2 122489 3 8 4 23
(Multiple Choice)
4.8/5 (37)
A data set contains three unique values. Which of the following must be true?
(Multiple Choice)
4.9/5 (36)
A population has a mean and standard deviation What number has a z-score of -0.1?
(Multiple Choice)
4.9/5 (40)
The following table presents the number of monthly users for the 7 most popular mobile apps.
Application Monthly Users (millions) Facebook 124.5 YouTube 103.4 Facebook Messenger 94.9 Google Search 84.1 Google Play 78.1 Google Maps 75.8 Pandora Radio 73.7
Find the median number of monthly users.
(Multiple Choice)
4.9/5 (35)
Filters
- Essay(0)
- Multiple Choice(0)
- Short Answer(0)
- True False(0)
- Matching(0)