Exam 11: Two-Sample Hypothesis Tests
Exam 1: Basic Ideas39 Questions
Exam 2: Graphical Summaries of Data40 Questions
Exam 3: Numerical Summaries of Data76 Questions
Exam 4: Summarizing Bivariate Data33 Questions
Exam 5: Probability99 Questions
Exam 6: Discrete Probability Distributions76 Questions
Exam 7: The Normal Distribution131 Questions
Exam 8: Confidence Intervals62 Questions
Exam 9: Hypothesis Testing115 Questions
Exam 10: Two-Sample Confidence Intervals44 Questions
Exam 11: Two-Sample Hypothesis Tests43 Questions
Exam 12: Tests With Qualitative Data26 Questions
Exam 13: Inference in Linear Models51 Questions
Exam 14: Analysis of Variance48 Questions
Exam 15: Nonparametric Statistics27 Questions
Select questions type
The following MINITAB output display presents the results of a hypothesis test for the difference between two population means. 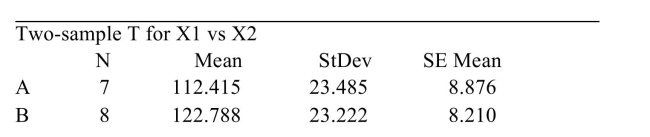 Difference
Estimate for difference:
CI for difference:
Test of difference vs not T-Value
How many degrees of freedom are there for the test statistic?
Difference
Estimate for difference:
CI for difference:
Test of difference vs not T-Value
How many degrees of freedom are there for the test statistic?
(Multiple Choice)
4.7/5  (40)
(40)
A sociologist studies a sample of college students to determine whether there are differences in the attitudes and behaviors of male and female students. The survey contains 20 questions. For one Question, which asks how much time students spend studying each week, the difference between Males and females is statistically significant with a P-value of 0.005. On all the other questions, the Differences are not statistically significant.
What P-value would be needed to conclude at the el that the time spent studying differs Between male and female students after applying the Bonferroni correction?
(Multiple Choice)
4.9/5 (40)
The following display from a TI-84 Plus calculator presents the results of a hypothesis test for the difference between two means. The sample sizes are 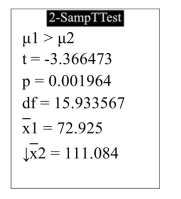 How many degrees of freedom did the calculator use?
(Multiple Choice)
4.9/5 (39)
A garden seed wholesaler wishes to test the claim that tomato seeds germinate faster when each individual seed is "pelletized" within a coating of corn starch. The table below shows the Germination times, in days, of six pelletized seeds. The table also shows the germination times in Days of six un-coated seeds (the controls). Pelletized: 10 8 8 10 6 7 Control: 9 11 10 8 10 13 Can you conclude that the mean germination time for pelletized seeds is less than the mean For the un-pelletized seeds? Use the level of significance.
(True/False)
4.9/5 (39)
Five null hypotheses were tested, and the P-values were: Hypothesis 1 2 3 4 5 P -value 0.007 0.016 0.006 0.023 0.004 Which hypotheses, if any, can be rejected at the 05 level?
(Multiple Choice)
4.8/5 (40)
Following is a sample of five matched pairs.
Sample 1 15 20 19 20 16 Sample 2 23 18 23 19 18
Let and represent the population means and let . A test will be made of the hypotheses versus . Compute the test statistic.
(Multiple Choice)
4.8/5 (37)
Four null hypotheses were tested, and the P-values were: Hypothesis 1 2 3 4 P -value 0.009 0.044 0.011 0.015 Which hypotheses, if any, can be rejected at the 05 level?
(Multiple Choice)
4.7/5 (33)
The concentration of hexane (a common solvent) was measured in units of micrograms per liter for a simple random sample of nineteen specimens of untreated ground water taken near a municipal Landfill. The sample mean was 289.2 with a sample standard deviation of 6.3. Twenty-two Specimens of treated ground water had an average hexane concentration of 285.3 with a standard Deviation of 7.6. It is reasonable to assume that both samples come from populations that are approximately normal. Can you Conclude that the mean hexane concentration is less in treated water than in untreated water? Use the α = Level of significance.
(True/False)
4.8/5 (32)
The following display from a TI-84 Plus calculator presents the results of a hypothesis test for the difference between two proportions. The sample sizes are 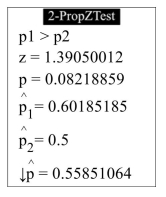
(True/False)
4.8/5 (29)
The following display from a TI-84 Plus calculator presents the results of a hypothesis test for the difference between two proportions. The sample sizes are 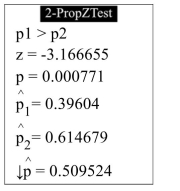 What is the P-value?
(Multiple Choice)
4.8/5 (26)
In an agricultural experiment, the effects of two fertilizers on the production of oranges were measured. Fourteen randomly selected plots of land were treated with fertilizer A, and 10 randomly Selected plots were treated with fertilizer B. The number of pounds of harvested fruit was measured From each plot. Following are the results. 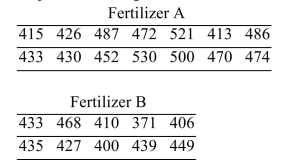 Assume that the populations are approximately normal. Can you conclude that there is a difference in the Mean yields for the two types of fertilizer? Use the level of significance.
(True/False)
4.8/5 (42)
The following MINITAB output display presents the results of a hypothesis test on the difference between two proportions. Test and CI for Two Proportions: P1, P2
Variable Sample P P1 56 94 0.595745 2 34 72 0.472222
Difference
Estimate for differenc 0.123523
CI for difference:
T-Test of difference vs not -Value Is this a left-tailed test, a right-tailed test, or a two tailed test?
(Multiple Choice)
4.9/5 (41)
A study reported that in a sample of 109 people who watch television news, 37 had elevated diastolic blood pressure levels (in millimeters of mercury, or mmHg). In a sample of 76 people who Do not watch television news, 12 had elevated diastolic blood pressure levels. Can you conclude that the proportion of people with elevated diastolic blood pressure levels differs between
News-watchers and those who do not watch news? Use the level of significance.
(True/False)
4.9/5 (42)
In a test for the difference between two proportions, the sample sizes were and , and the numbers of events were and . A test is made of the hypothesis versus . Compute the value of the test statistic.
(Multiple Choice)
4.8/5 (35)
The following display from a TI-84 Plus calculator presents the results of a hypothesis test for the difference between two means. The sample sizes are 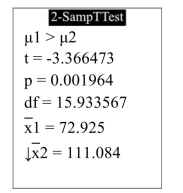
(True/False)
4.9/5 (34)
In an experiment to determine whether there is a systematic difference between the weights obtained with two different mass balances, six specimens were weighed, in grams, on each balance. The following data
Were obtained: 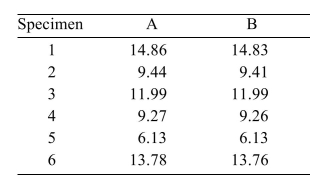 Compute the test statistic.
(Multiple Choice)
4.8/5 (37)
In an experiment to determine whether there is a systematic difference between the weights obtained with two different mass balances, six specimens were weighed, in grams, on each balance. The following data
Were obtained: 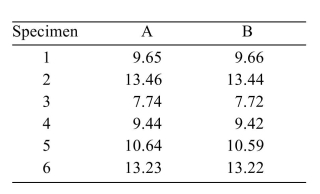 State the null and alternate hypotheses.
(Multiple Choice)
4.7/5 (42)
A study reported that in a sample of 93 men, 23 had elevated total cholesterol levels (more than 200 milligrams per deciliter). In a sample of 104 women, 21 had elevated cholesterol levels. Can you conclude that the proportion of people with elevated cholesterol levels differs between men and Women? Use the level of significance.
(True/False)
4.8/5 (34)
The bowling scores of a professional bowler during a two-day tournament are shown below. 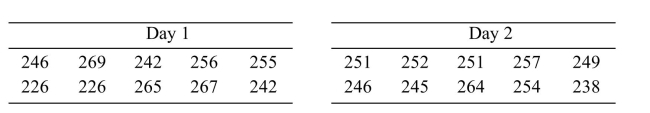 Can you conclude that the variability of the scores is greater on the second day than on the first day? Use the level of significance.
(True/False)
4.8/5 (39)
Filters
- Essay(0)
- Multiple Choice(0)
- Short Answer(0)
- True False(0)
- Matching(0)