Exam 16: Decision Making and Payoff Tables in Investment Scenarios
Exam 1: What Is Statistics79 Questions
Exam 2: Describing Data: Frequencydistributions and Graphic Presentation100 Questions
Exam 3: Describing Data: Numerical Measures214 Questions
Exam 4: Describing Data: Displaying and Exploring Pata138 Questions
Exam 5: A Sulvey of Probability Concepts121 Questions
Exam 6: Discrete Probability Distributions145 Questions
Exam 7: Continuous Probabilitydistributions79 Questions
Exam 8: Sampling Methods and the Central Umit Theorem134 Questions
Exam 9: Estimation and Confidence Intervals140 Questions
Exam 10: One-Sample Tests of Hypothesis111 Questions
Exam 11: Two Sample Tests of Hypothesis103 Questions
Exam 12: Analysis of Variance173 Questions
Exam 13: Linear Regression and Correlation132 Questions
Exam 14: Multiple Regression and Correlation Analysis126 Questions
Exam 15: Chi-Square Applications94 Questions
Exam 16: Decision Making and Payoff Tables in Investment Scenarios151 Questions
Select questions type
i. In a time series analysis, the letter "a" in the linear trend equation, is the value of  when t = 0.
ii. In the linear trend equation, t is any value that corresponds with a time period, i.e., month or
Quarter.
iii. If the sales, production or other data over a period of time tend to approximate a straight-line
Trend, the equation developed by the least squares method cannot be used to forecast sales for a
Future period.
when t = 0.
ii. In the linear trend equation, t is any value that corresponds with a time period, i.e., month or
Quarter.
iii. If the sales, production or other data over a period of time tend to approximate a straight-line
Trend, the equation developed by the least squares method cannot be used to forecast sales for a
Future period.
Free
(Multiple Choice)
4.8/5  (31)
(31)
Correct Answer: Verified
B
Listed below is the net sales in $ million for Home Depot Inc., and its subsidiaries from 1994 to
2003.  Using the printout below, what are the estimated sales for 2011?
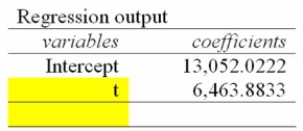
Free
(Multiple Choice)
4.9/5 (36)
Correct Answer:Verified
C
i. Long-term forecasts are usually from one year to more than 10 years into the future.
ii. A forecast is considered necessary in order to have the raw materials, production facilities, and
Staff available to meet estimated future demands.
iii. Many business and economic time series have a recurring seasonal pattern.
Free
(Multiple Choice)
4.9/5 (30)
Correct Answer:Verified
A
Listed below is the net sales in $ million for Home Depot Inc., and its subsidiaries from 1994 to
2003. 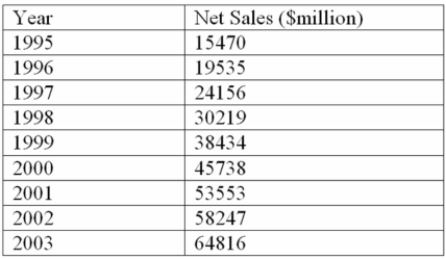 Using the printout below, what are the estimated sales for 2010?
(Multiple Choice)
4.8/5 (28)
For an annual time series extending from 1993 through 2001, how many years would be lost in a
five-year moving average?
(Multiple Choice)
4.8/5 (32)
Which of the following is true for the exponential equation?
(Multiple Choice)
4.8/5 (30)
You are trying to decide in which of the three companies you should invest. Refer to the following
Payoff Table. 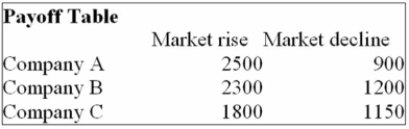 If the probability of the market declining in the next year is 0.4, which of the following statements
Are correct?
i. The Expected value of stock purchased under conditions of certainty is $1,980.
ii. The Expected value of stock purchased under conditions of certainty is $120.
iii. The Expected value of stock purchased under conditions of certainty is $440.
If the probability of the market declining in the next year is 0.4, which of the following statements
Are correct?
i. The Expected value of stock purchased under conditions of certainty is $1,980.
ii. The Expected value of stock purchased under conditions of certainty is $120.
iii. The Expected value of stock purchased under conditions of certainty is $440.
(Multiple Choice)
4.8/5 (33)
For a three-year moving average, how many values will be lost at the beginning and end of the time
Series?
(Multiple Choice)
4.8/5 (33)
Determine the expected value for the following payoff table. 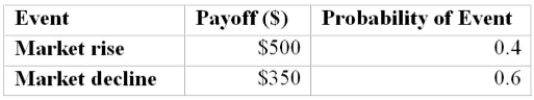
(Multiple Choice)
4.7/5 (42)
You have a decision to invest $10,000 in any of four different companies. You estimate the
Probabilities that the economy will be favorable or unfavorable and you estimate the percent
Returns over the next year. 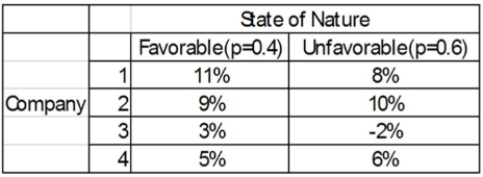 What is the expected value for Company 1?
(Multiple Choice)
4.7/5 (34)
Suppose that the below represents the opportunity loss table for three stocks based on whether
The market rises or declines. If there is a 30% chance of the market rising and a 70% chance of it
Declining, what is the expected opportunity loss for stock C? 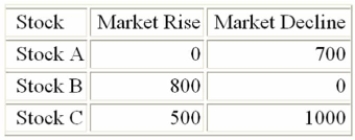
(Multiple Choice)
4.9/5 (35)
If the exports ($ millions) for the period 1997 through 2001 were $878, $892, $864, $870, and $912
Respectively, what are these values called?
(Multiple Choice)
4.7/5 (32)
You have a decision to invest $10,000 in any of four different companies. You estimate the
Probabilities that the economy will be favorable or unfavorable and you estimate the percent
Returns over the next year. 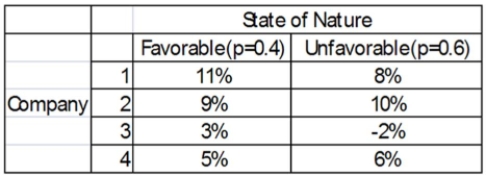 What is the expected value for Company 2?
(Multiple Choice)
5.0/5 (26)
You are trying to decide in which of the three companies you should invest. Refer to the following
Payoff Table. 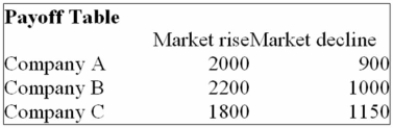 If the market declines in the next year, which of the following statements are correct?
i. The Opportunity Loss for Company A is $250.
ii. The Opportunity Loss for Company B is $150.
iii. The Opportunity Loss for Company C is $0.
If the market declines in the next year, which of the following statements are correct?
i. The Opportunity Loss for Company A is $250.
ii. The Opportunity Loss for Company B is $150.
iii. The Opportunity Loss for Company C is $0.
(Multiple Choice)
4.7/5 (42)
i. The irregular component of a time series is the easiest to measure.
ii. The ratio-to-moving average method removes the time series trend component, resulting in 12
Numbers that are called specific seasonals.
iii. For a quarterly time series, the initial step, using the ratio-to-moving average method, is to
Remove the seasonal components from the time series using a 3-month centered moving average.
(Multiple Choice)
5.0/5 (31)
What is variation within a year, such as high sales at Christmas and Easter and low sales in January,
Called?
(Multiple Choice)
4.9/5 (41)
You are trying to decide in which of the three companies you should invest. Refer to the following
Payoff Table. 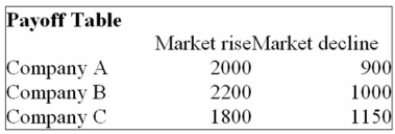 If the market rises in the next year, which of the following statements are correct?
i. The Opportunity Loss for Company A is $200.
ii. The Opportunity Loss for Company B is $0.
iii. The Opportunity Loss for Company C is $400.
If the market rises in the next year, which of the following statements are correct?
i. The Opportunity Loss for Company A is $200.
ii. The Opportunity Loss for Company B is $0.
iii. The Opportunity Loss for Company C is $400.
(Multiple Choice)
4.8/5 (26)
An investor has a 35% chance of making $1000 and a 65% chance of making $10 000, what is the
Expected payoff for this investor?
(Multiple Choice)
4.8/5 (39)
You are trying to decide in which of the three companies you should invest. Refer to the following
Payoff Table. 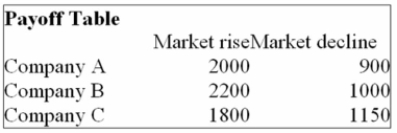 If the market declines in the next year, which of the following statements are correct?
i. The Opportunity Loss for Company A is $250.
ii. The Opportunity Loss for Company B is $30.
iii. The Opportunity Loss for Company C is $500.
If the market declines in the next year, which of the following statements are correct?
i. The Opportunity Loss for Company A is $250.
ii. The Opportunity Loss for Company B is $30.
iii. The Opportunity Loss for Company C is $500.
(Multiple Choice)
4.9/5 (32)
Filters
- Essay(0)
- Multiple Choice(0)
- Short Answer(0)
- True False(0)
- Matching(0)