Exam 2: Describing Data: Frequencydistributions and Graphic Presentation
Exam 1: What Is Statistics79 Questions
Exam 2: Describing Data: Frequencydistributions and Graphic Presentation100 Questions
Exam 3: Describing Data: Numerical Measures214 Questions
Exam 4: Describing Data: Displaying and Exploring Pata138 Questions
Exam 5: A Sulvey of Probability Concepts121 Questions
Exam 6: Discrete Probability Distributions145 Questions
Exam 7: Continuous Probabilitydistributions79 Questions
Exam 8: Sampling Methods and the Central Umit Theorem134 Questions
Exam 9: Estimation and Confidence Intervals140 Questions
Exam 10: One-Sample Tests of Hypothesis111 Questions
Exam 11: Two Sample Tests of Hypothesis103 Questions
Exam 12: Analysis of Variance173 Questions
Exam 13: Linear Regression and Correlation132 Questions
Exam 14: Multiple Regression and Correlation Analysis126 Questions
Exam 15: Chi-Square Applications94 Questions
Exam 16: Decision Making and Payoff Tables in Investment Scenarios151 Questions
Select questions type
Refer to the following price of jeans are recorded to the nearest dollar:
The first two class midpoints are $62.50 and $65.50.
What is the class interval?
Free
(Multiple Choice)
4.7/5  (32)
(32)
Correct Answer: Verified
D
When a class interval is expressed as: 100 to under 200
(i. Observations with values of 100 are included from the class frequency.
(ii. Observations with values of 200 are included in the class frequency.
(iii) Observations with values of 200 are excluded from the class frequency.
Free
(Multiple Choice)
4.8/5 (31)
Correct Answer:Verified
C
(i. A table showing the number of observations that have been grouped into each of several classes
Is called a frequency distribution.
(ii. When classes in a frequency table are constructed so that data will fit into only one category, it is
Called mutually exclusive.
(iii) The suggested class interval based on number of observations given the data ranges from 100
To 200 with 50 observations is 20
Free
(Multiple Choice)
4.8/5 (38)
Correct Answer:Verified
A
One rule that must always be followed in constructing frequency distributions is that _______.
(Multiple Choice)
4.9/5 (34)
A student was interested in the cigarette smoking habits of college students and collected data
From an unbiased random sample of students. The data is summarized in the following table: 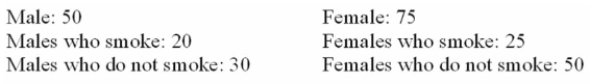 Why is the table NOT a frequency table?
(Multiple Choice)
4.8/5 (48)
(i. Bar charts are useful for showing the percent that various components compose of the total.
(ii. Simple bar charts may be constructed either horizontally or vertically.
(iii) A frequency polygon is ideal for showing the trend or sales of income over time.
(Multiple Choice)
4.7/5 (41)
What is the class interval for the table of commissions above?
(Multiple Choice)
4.8/5 (33)
Statistics Canada report 2010 results in the following chart. 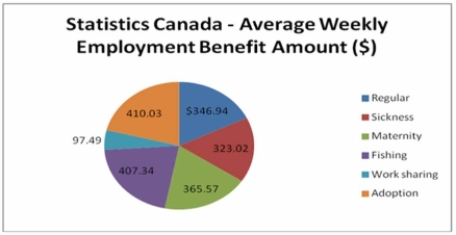 Is the data quantitative or qualitative? What is the name of the table shown?
(Multiple Choice)
4.8/5 (29)
Refer to the following price of jeans are recorded to the nearest dollar:
The first two class midpoints are $62.50 and $65.50.
What are the class limits for the lowest class?
(Multiple Choice)
5.0/5 (31)
Given the following stem and leaf plot, determine the largest value in the data set. 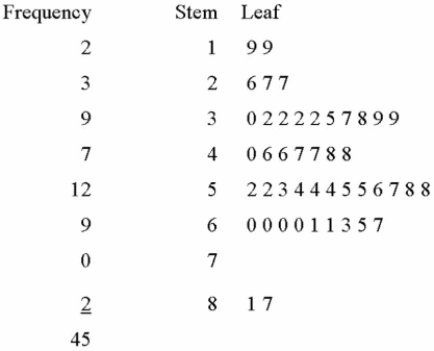
(Multiple Choice)
4.7/5 (38)
For the distribution of ages above, what is the relative class frequency for the lowest class?
(Multiple Choice)
5.0/5 (42)
The following ages (rounded to the nearest whole year) of employees at a large company that were
Grouped into a distribution with class limits:
20 up to 30
30 up to 40
40 up to 50
50 up to 60
60 up to 70
(i. The class limits for the class 50 up to 60 class are 50 and 58.
(ii. The midpoint for the class 40 up to 50 is 45.
(iii) The class interval is 10.
(Multiple Choice)
4.8/5 (38)
The following ages (rounded to the nearest whole year) of employees at a large company that were
Grouped into a distribution with class limits:
20 up to 30
30 up to 40
40 up to 50
50 up to 60
60 up to 70
(i. The class limits for the class 50 up to 60 class are 50 and 58.
(ii. The midpoint for the class 40 up to 50 is 40.
(iii) The class interval is 9.
(Multiple Choice)
5.0/5 (21)
Which is the best (most informative and useful) graphical display of the Average Weekly Earnings
Health Care in Canada over the years 2008 to 2012?
(Multiple Choice)
4.8/5 (42)
The following represent the ages of students in a class:
19, 23, 21, 19, 19, 20, 22, 31, 21, 20
If a stem and leaf plot were to be developed from this, how many leaves would there be off the
Second stem?
(Multiple Choice)
4.8/5 (34)
A group of 100 students were surveyed about their interest in a new International Studies program.
The survey asked students about their interest in the program in terms of high, medium, or low. 30
Students responded high interest; 50 students responded medium interest; 20 students responded
Low interest. What is the relative frequency of students with high interest?
(Multiple Choice)
4.8/5 (32)
Consider the following stem and leaf plot: 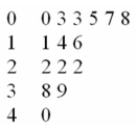 Suppose that you decided to develop a frequency distribution from this plot.
What would be the lower limit of the first class?
Suppose that you decided to develop a frequency distribution from this plot.
What would be the lower limit of the first class?
(Multiple Choice)
4.9/5 (24)
Filters
- Essay(0)
- Multiple Choice(0)
- Short Answer(0)
- True False(0)
- Matching(0)