Exam 13: Linear Regression and Correlation
Exam 1: What Is Statistics79 Questions
Exam 2: Describing Data: Frequencydistributions and Graphic Presentation100 Questions
Exam 3: Describing Data: Numerical Measures214 Questions
Exam 4: Describing Data: Displaying and Exploring Pata138 Questions
Exam 5: A Sulvey of Probability Concepts121 Questions
Exam 6: Discrete Probability Distributions145 Questions
Exam 7: Continuous Probabilitydistributions79 Questions
Exam 8: Sampling Methods and the Central Umit Theorem134 Questions
Exam 9: Estimation and Confidence Intervals140 Questions
Exam 10: One-Sample Tests of Hypothesis111 Questions
Exam 11: Two Sample Tests of Hypothesis103 Questions
Exam 12: Analysis of Variance173 Questions
Exam 13: Linear Regression and Correlation132 Questions
Exam 14: Multiple Regression and Correlation Analysis126 Questions
Exam 15: Chi-Square Applications94 Questions
Exam 16: Decision Making and Payoff Tables in Investment Scenarios151 Questions
Select questions type
It has been hypothesized that overall academic success for freshmen at college as measured by
Grade point average (GPA) is a function of IQ scores (X1), hours spent studying each week (X2), and
One's high school average (X3). Suppose the regression equation is:
Y' = -6.9 + 0.055X1 + 0.107X2 + 0.0083X3.
The multiple standard error is 6.313 and R2 = 0.826.What will the GPA be if the number of hours
Spent studying is 30 the IQ is 108, and the high school average is 82?
Free
(Multiple Choice)
4.8/5  (36)
(36)
Correct Answer: Verified
B
Angela Chou has been asked to investigate the determinants of poverty in Ontario communities.
She collected data on 60 communities from Statistics Canada. She selected the percentage of poor
Persons living under the poverty line [Poor (%)], measured by Low Income Cut-Off, designed by
Statistics Canada as a measure of poverty for a community, as the dependent variable. The
Independent variables selected are percent of single families in each community, the
Unemployment rate in each community, percent of population in the community holding a bachelor's
Degree as their highest level of education attained, and percent of population holding a High
School Diploma as their highest level of education attained.
Given the regression equation Poor (%) = -3.81 + 0.798 Single-Families (%) + 0.624 Unemployment
Rate (%) - 0.170 Bachelor's Degree (%) - 0.003 High School (%).-
What is the estimated percentage of poor persons living below the poverty line in a community with
5% of the community as single-families, a 5% unemployment rate, only 5% holding a Bachelor's
Degree and 25% having High School as their highest attained educational level?
Free
(Multiple Choice)
4.9/5 (43)
Correct Answer:Verified
A
In regression analysis, the dferr = ________.
Free
(Multiple Choice)
4.9/5 (35)
Correct Answer:Verified
B
What is the difference in selling prices of a house with 1,700 square feet and one with 1,800 square
Feet?
(Multiple Choice)
4.9/5 (39)
The information below is from the multiple regression analysis computer output for 28 teams in
Major League Baseball. The model is designed to predict wins using attendance, payroll, batting
Average, home runs, stolen bases, errors, and team ERA.  The t-value computed for testing the coefficient "Batg. Avg." is:
(Multiple Choice)
4.8/5 (32)
i. Multiple regression is used when two or more independent variables are used to predict a value
Of a single dependent variable.
ii. The values of b1, b2 and b3 in a multiple regression equation are called the net regression
Coefficients. They indicate the change in the predicted value for a unit change in one X when the
Other X variables are held constant.
iii. Autocorrelation often happens when data has been collected over periods of time.
(Multiple Choice)
4.8/5 (28)
i. Multiple R2 measures the proportion of explained variation.
ii. 90% of total variation in the dependent variable is explained by the independent variable for a
Multiple R2= 0.90.
iii. The multiple standard error of estimate measures the variation about the regression plane when
Two independent variables are considered.
(Multiple Choice)
4.7/5 (40)
i. Multiple regression analysis examines the relationship of several dependent variables on the
Independent variable.
ii. A multiple regression equation defines the relationship between the dependent variable and the
Independent variables in the form of an equation.
iii. Autocorrelation often happens when data has been collected over periods of time.
(Multiple Choice)
4.8/5 (40)
Which of the following is a characteristic of the F-distribution?
(Multiple Choice)
4.9/5 (28)
Which variable in the model is the most significant predictor of tire production?
(Multiple Choice)
4.8/5 (35)
The following summary is from home heating costs, using mean outside temperature as X1 the
Number of centimetres of insulation as X2, and the presence of a garage as X3.
Is the presence of the independent variable garage significant in predicting heating costs, when
Tested at the 0.01 level of significance? 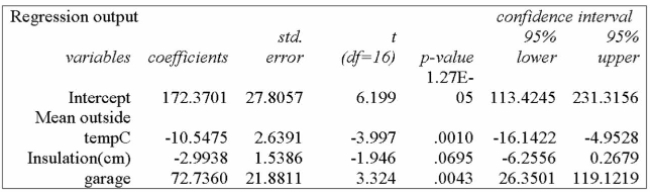
(Multiple Choice)
4.9/5 (24)
The best example of an alternate hypothesis for a global test of a multiple regression model is:
(Multiple Choice)
4.9/5 (36)
The information below is from the multiple regression analysis computer output for 28 teams in
Major League Baseball. The model is designed to predict wins using attendance, payroll, batting
Average, home runs, stolen bases, errors, and team ERA. 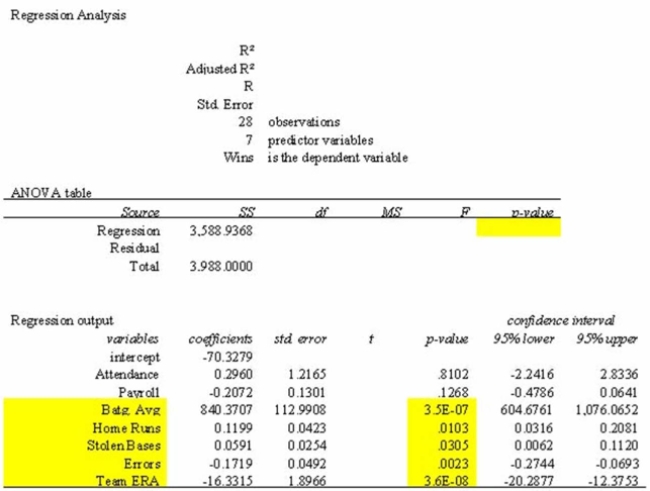 The critical value of F to be used in the global test of the model is: (5% level of significance)
(Multiple Choice)
4.8/5 (32)
Angela Chou has been asked to investigate the determinants of poverty in Ontario communities.
She collected data on 60 communities from Statistics Canada. She selected the percentage of poor
Persons living under the poverty line [Poor (%)], measured by Low Income Cut-Off, designed by
Statistics Canada as a measure of poverty for a community, as the dependent variable. The
Independent variables selected are percent of single families in each community, the
Unemployment rate in each community, and percent of population in the community holding a
Bachelor's degree as their highest level of education attained. ![Angela Chou has been asked to investigate the determinants of poverty in Ontario communities. She collected data on 60 communities from Statistics Canada. She selected the percentage of poor Persons living under the poverty line [Poor (%)], measured by Low Income Cut-Off, designed by Statistics Canada as a measure of poverty for a community, as the dependent variable. The Independent variables selected are percent of single families in each community, the Unemployment rate in each community, and percent of population in the community holding a Bachelor's degree as their highest level of education attained. Determine the regression equation.](https://storage.examlex.com/TB1024/11eb5577_42fb_f6ca_a086_635c66076f52_TB1024_00.jpg) Determine the regression equation.
Determine the regression equation.
(Multiple Choice)
4.9/5 (38)
Hypotheses concerning individual regression coefficients are tested using which statistic?
(Multiple Choice)
4.8/5 (32)
In a multiple regression analysis, the following correlation matrix was computed. 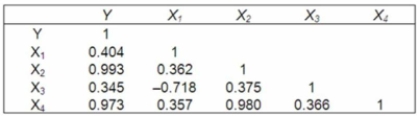 Which independent variable(s) are highly correlated with the dependent variable?
(Multiple Choice)
4.8/5 (36)
What is the effect on salary for an increase of one level of responsibility if the other variables are
Held constant?
(Multiple Choice)
4.8/5 (31)
A sample of General Mills employees was studied to determine their degree of satisfaction with
Their present life. A special index, called the index of satisfaction, was used to measure satisfaction.
Six factors were studied: age at the time of first marriage (X1), annual income (X2), number of
Children living (X3), value of all assets (X4), status of health in the form of an index (X5), and the
Average number of social activities per week (X6). Suppose the multiple regression equation is:
Y' = 16.24 + 0.017X1 + 0.00028X2 + 42X3 + 0.0012X4 + 0.09X5 + 26.8X6.
Explain the meaning of b2.
(Multiple Choice)
4.7/5 (38)
The following graph is used to evaluate two assumptions of a multiple regression analysis. What are
The two assumptions? 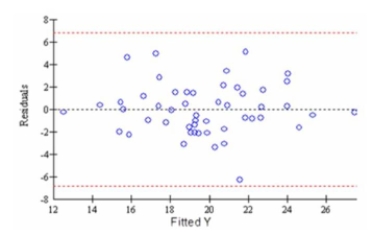
(Multiple Choice)
4.8/5 (35)
Filters
- Essay(0)
- Multiple Choice(0)
- Short Answer(0)
- True False(0)
- Matching(0)