Exam 10: One-Sample Tests of Hypothesis
Exam 1: What Is Statistics79 Questions
Exam 2: Describing Data: Frequencydistributions and Graphic Presentation100 Questions
Exam 3: Describing Data: Numerical Measures214 Questions
Exam 4: Describing Data: Displaying and Exploring Pata138 Questions
Exam 5: A Sulvey of Probability Concepts121 Questions
Exam 6: Discrete Probability Distributions145 Questions
Exam 7: Continuous Probabilitydistributions79 Questions
Exam 8: Sampling Methods and the Central Umit Theorem134 Questions
Exam 9: Estimation and Confidence Intervals140 Questions
Exam 10: One-Sample Tests of Hypothesis111 Questions
Exam 11: Two Sample Tests of Hypothesis103 Questions
Exam 12: Analysis of Variance173 Questions
Exam 13: Linear Regression and Correlation132 Questions
Exam 14: Multiple Regression and Correlation Analysis126 Questions
Exam 15: Chi-Square Applications94 Questions
Exam 16: Decision Making and Payoff Tables in Investment Scenarios151 Questions
Select questions type
To compare the effect of weather on sales of soft drinks, a soda manufacturer sampled two regions
Of the country with the following results. Is there a difference in sales between the 2 regions?  i. The alternate hypothesis is pa - pb ≠ 0.
ii. The pooled estimate of the population proportion is 0.36.
iii. Using the 1% level of significance, the critical value is ±1.96.
i. The alternate hypothesis is pa - pb ≠ 0.
ii. The pooled estimate of the population proportion is 0.36.
iii. Using the 1% level of significance, the critical value is ±1.96.
Free
(Multiple Choice)
4.8/5  (29)
(29)
Correct Answer: Verified
B
The results of a mathematics placement exam at Mercy College for two campuses are as follows: 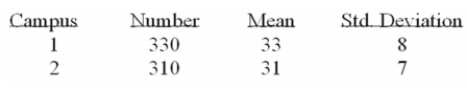 What is the p-value if the computed test statistic is 4.1?
Free
(Multiple Choice)
4.8/5 (44)
Correct Answer:Verified
B
To compare the effect of weather on sales of soft drinks, a soda manufacturer sampled two regions
Of the country with the following results. Is there a difference in sales between the 2 regions? 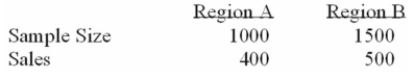 i. The alternate hypothesis is pa - pb ≠ 0.
ii. The proportion of sales made in Market Area 1 is 0.40.
iii. The proportion of sales made in Market Area 2 is 0.33.
i. The alternate hypothesis is pa - pb ≠ 0.
ii. The proportion of sales made in Market Area 1 is 0.40.
iii. The proportion of sales made in Market Area 2 is 0.33.
Free
(Multiple Choice)
4.8/5 (27)
Correct Answer:Verified
A
A recent study compared the time spent together by single and dual-earner couples. According to
The records kept during the study, the mean amount of time spent together watching TV among
Single-earner couples was 64 minutes per day, with a standard deviation of 15.5 minutes. For the
Dual-earner couples, the mean time was 48.4 and the standard deviation was 18.1. At a 0.01
Significance level, can we conclude that the single-earner couples on average spend more time
Watching TV together? There were 20 single-earner and 12 dual-earner couples studied. State the
Decision rule, the value of the test statistic, and your decision.
(Multiple Choice)
4.8/5 (32)
If the decision is to reject the null hypothesis at the 5% level of significance, what are the
Acceptable alternate hypothesis and rejection region?
(Multiple Choice)
4.8/5 (38)
Suppose we test H0: π1 = π2 at the 0.05 level of significance. If the z-test statistic is -1.07, what is
Our decision?
(Multiple Choice)
4.8/5 (20)
The employees at the East Vancouver office of a multinational company are demanding higher
Salaries than those offered at the company office located in Oshawa Ontario. Their justification for
The pay difference is that the difference between the average price of single-family houses in East
Vancouver and that in Oshawa is more than $60,000. Before making a decision, the company
Management wants to study the difference in the prices of single-family houses for sale at the two
Locations.
The results of their search of recent house sales are as follows (in $1000, rounded to the nearest
Thousand): 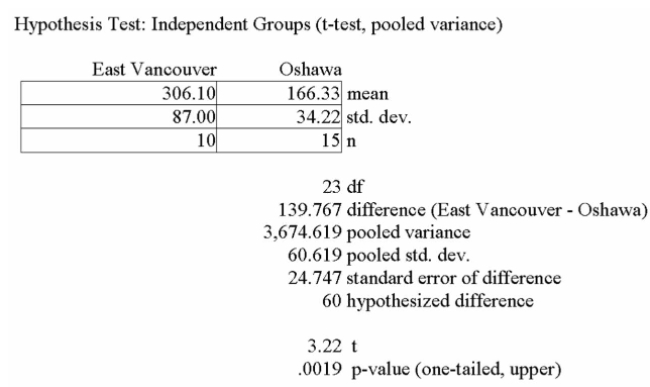 What is the decision at the 5% level of significance?
(Multiple Choice)
4.7/5 (43)
What is the critical value for a one-tailed hypothesis test in which a null hypothesis is tested at the
5% level of significance based on two samples, both sample sizes are 13?
(Multiple Choice)
4.7/5 (43)
A company is researching the effectiveness of a new website design to decrease the time to access
A website. Five website users were randomly selected, and their times (in seconds) to access the
Website with the old and new designs were recorded. To compare the times, they computed (new
Website design time - old website design time). The results follow: 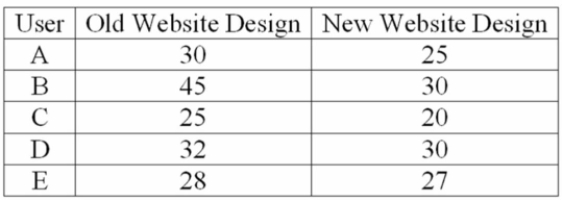 For a 0.01 significance level, what is the critical value?
(Multiple Choice)
4.9/5 (29)
i. If the null hypothesis states that there is no difference between the mean income of males and the
Mean income of females, then the test is one-tailed.
ii. If we are testing for the difference between two population means, it is assumed that the sample
Observations from one population are independent of the sample observations from the other
Population.
iii. When sample sizes are less than 30, a test for the differences between two population means
Has n - 1 degrees of freedom.
(Multiple Choice)
4.9/5 (37)
A local retail business wishes to determine if there is a difference in preferred indoor temperature
Between men and women. A random sample of data is collected, with the following results (note:
There are slight differences between Excel and MegaStat output in this test):  Using a 0.05 level of significance, can we conclude that there is indeed a difference in the
Temperature that men prefer compared to women?
What is the null hypothesis if we assume men to be group 1 and women group 2?
Using a 0.05 level of significance, can we conclude that there is indeed a difference in the
Temperature that men prefer compared to women?
What is the null hypothesis if we assume men to be group 1 and women group 2?
(Multiple Choice)
5.0/5 (33)
A recent study compared the time spent together by single and dual-earner couples. According to
The records kept during the study, the mean amount of time spent together watching TV among
Single-earner couples was 60 minutes per day, with a standard deviation of 15.5 minutes. For the
Dual-earner couples, the mean time was 48.4 and the standard deviation was 18.1. At a 0.01
Significance level, can we conclude that the single-earner couples on average spend more time
Watching TV together? There were 12 single-earner and 12 dual-earner couples studied. State the
Decision rule, the value of the test statistic, and your decision.
(Multiple Choice)
4.8/5 (39)
The employees at the East Vancouver office of a multinational company are demanding higher
Salaries than those offered at the company office located in Oshawa Ontario. Their justification for
The pay difference is that the difference between the average price of single-family houses in East
Vancouver and that in Oshawa is more than $60,000. Before making a decision, the company
Management wants to study the difference in the prices of single-family houses for sale at the two
Locations.
The results of their search of recent house sales are as follows (in $000, rounded to the nearest
Thousand):  Assuming that the population distributions are approximately normal, can we conclude at the 0.05
Significance level that the difference between the two population means is greater than $60,000?
What is the decision at the 5% level of significance?
Assuming that the population distributions are approximately normal, can we conclude at the 0.05
Significance level that the difference between the two population means is greater than $60,000?
What is the decision at the 5% level of significance?
(Multiple Choice)
4.8/5 (24)
A local retail business wishes to determine if there is a difference in preferred indoor temperature
Between men and women. A random sample of data is collected, with the following results (note:
There are slight differences between Excel and MegaStat output in this test):  If you use the 5% level of significance, what is the critical t value?
(Multiple Choice)
4.9/5 (27)
Of 150 adults who tried a new peach-flavoured peppermint patty, 81 rated it excellent. Of 200
Children sampled, 123 rated it excellent. Using the 0.10 level of significance, can we conclude that
There is a significant difference in the proportion of adults and the proportion of children who rate
The new flavour as excellent? State the decision rule, the value of the test statistic, and your
Decision.
(Multiple Choice)
4.9/5 (28)
The employees at the East Vancouver office of a multinational company are demanding higher
Salaries than those offered at the company office located in Oshawa Ontario. Their justification for
The pay difference is that the difference between the average price of single-family houses in East
Vancouver and that in Oshawa is more than $60,000. Before making a decision, the company
Management wants to study the difference in the prices of single-family houses for sale at the two
Locations.
The results of their search of recent house sales are as follows (in $1000, rounded to the nearest
Thousand):  Assuming that the population distributions are approximately normal, can we conclude at the 0.05
Significance level that the difference between the two population means is greater than $60,000?
If we let East Vancouver be population 1 and Oshawa be population 2, what is the null hypothesis?
Assuming that the population distributions are approximately normal, can we conclude at the 0.05
Significance level that the difference between the two population means is greater than $60,000?
If we let East Vancouver be population 1 and Oshawa be population 2, what is the null hypothesis?
(Multiple Choice)
4.8/5 (40)
A local retail business wishes to determine if there is a difference in preferred indoor temperature
Between men and women. A random sample of data is collected, with the following results (note:
There are slight differences between Excel and MegaStat output in this test): 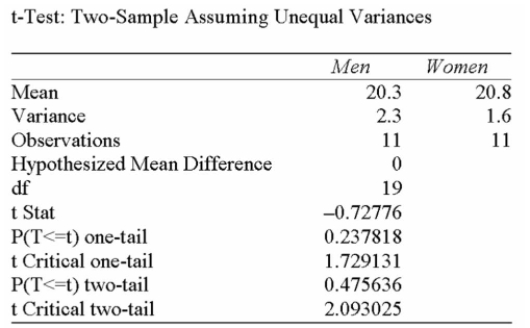 What is the degree of freedom?
(Multiple Choice)
4.7/5 (29)
To compare the effect of weather on sales of soft drinks, a soda manufacturer sampled two regions
Of the country with the following results. Is there a difference in sales between the 2 regions?  i. The null hypothesis is pa - pb > 0.
ii. The alternate hypothesis is pa - pb ≠ 0.
iii. The pooled estimate of the population proportion is 0.36.
i. The null hypothesis is pa - pb > 0.
ii. The alternate hypothesis is pa - pb ≠ 0.
iii. The pooled estimate of the population proportion is 0.36.
(Multiple Choice)
4.8/5 (40)
To compare the effect of weather on sales of soft drinks, a soda manufacturer sampled two regions
Of the country with the following results. Is there a difference in sales between the 2 regions?  i. The alternate hypothesis is pa - pb ≠ 0.
ii. Using the 1% level of significance, the critical value is ±2.58.
iii. The z-statistic is 3.40.
i. The alternate hypothesis is pa - pb ≠ 0.
ii. Using the 1% level of significance, the critical value is ±2.58.
iii. The z-statistic is 3.40.
(Multiple Choice)
4.8/5 (40)
i. If samples taken from two populations are not independent, then a test of paired differences is
Applied.
ii. The paired difference test has (n1 + n2 - 2) degrees of freedom.
iii. A statistics professor wants to compare grades of two different groups of students taking the
Same course in two different sections. This is an example of a paired sample.
(Multiple Choice)
4.7/5 (37)
Filters
- Essay(0)
- Multiple Choice(0)
- Short Answer(0)
- True False(0)
- Matching(0)