Exam 3: Numerical Descriptive Measures
Exam 1: Introduction145 Questions
Exam 2: Organizing and Visualizing Data210 Questions
Exam 3: Numerical Descriptive Measures153 Questions
Exam 4: Basic Probability171 Questions
Exam 5: Discrete Probability Distributions218 Questions
Exam 6: The Normal Distribution and Other Continuous Distributions191 Questions
Exam 7: Sampling and Sampling Distributions197 Questions
Exam 8: Confidence Interval Estimation196 Questions
Exam 9: Fundamentals of Hypothesis Testing: One-Sample Tests165 Questions
Exam 10: Two-Sample Tests210 Questions
Exam 11: Analysis of Variance213 Questions
Exam 12: Chi-Square Tests and Nonparametric Tests201 Questions
Exam 13: Simple Linear Regression213 Questions
Exam 14: Introduction to Multiple Regression355 Questions
Exam 15: Multiple Regression Model Building96 Questions
Exam 16: Time-Series Forecasting168 Questions
Exam 17: Statistical Applications in Quality Management133 Questions
Exam 18: A Roadmap for Analyzing Data54 Questions
Exam 19: Questions that Involve Online Topics321 Questions
Select questions type
TABLE 3-3
The ordered array below represents the number of vitamin supplements sold by a health food store in a sample of 16 days.
19, 19, 20, 20, 22, 23, 25, 26, 27, 30, 33, 34, 35, 36, 38, 41
Note: For this sample, the sum of the values is 448, and the sum of the squared differences between each value and the mean is 812.
-Referring to Table 3-3, the median number of vitamin supplements sold in this sample is ________.
(Short Answer)
4.9/5  (35)
(35)
TABLE 3-1
Health care issues are receiving much attention in both academic and political arenas. A sociologist recently conducted a survey of citizens over 60 years of age whose net worth is too high to qualify for Medicaid. The ages of 25 senior citizens were as follows:  -Referring to Table 3-1, determine the interquartile range of the ages of the senior citizens.
(Short Answer)
4.8/5 (41)
As a general rule, a value is considered an extreme value if its Z score is greater than 3.
(True/False)
4.9/5 (43)
Which measure of central tendency can be used for both numerical and categorical variables?
(Multiple Choice)
4.9/5 (42)
TABLE 3-4
The ordered array below represents the number of cargo manifests approved by customs inspectors of the Port of New York in a sample of 35 days:
16, 17, 18, 18, 19, 20, 20, 21, 21, 21, 22, 22, 22, 22, 23, 23, 23, 23, 24, 24, 24, 25, 25, 26, 26, 26, 27, 28, 28, 29, 29, 31, 31, 32, 32
Note: For this sample, the sum of the values is 838, and the sum of the squared differences between each value and the mean is 619.89.
-Referring to Table 3-4, the arithmetic mean of the customs data is ________.
(Short Answer)
4.7/5 (39)
TABLE 3-9
The following table represents the assets in billions of dollars of the five largest bond funds.
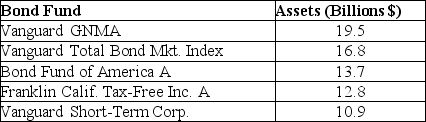 -Referring to Table 3-9, what is the mean for this population of the five largest bond funds?
(Short Answer)
4.9/5 (41)
TABLE 3-4
The ordered array below represents the number of cargo manifests approved by customs inspectors of the Port of New York in a sample of 35 days:
16, 17, 18, 18, 19, 20, 20, 21, 21, 21, 22, 22, 22, 22, 23, 23, 23, 23, 24, 24, 24, 25, 25, 26, 26, 26, 27, 28, 28, 29, 29, 31, 31, 32, 32
Note: For this sample, the sum of the values is 838, and the sum of the squared differences between each value and the mean is 619.89.
-Referring to Table 3-4, the standard deviation of the customs data is ________.
(Short Answer)
4.8/5 (31)
The interquartile range is a measure of variation or dispersion in a set of data.
(True/False)
4.8/5 (34)
If the arithmetic mean of a numerical data set is greater than the median, the data are considered to be ________ skewed.
(Short Answer)
4.9/5 (39)
TABLE 3-11
Given below are the closing prices for the Dow Jones Industrial Average (DJIA) and the Standard & Poor's (S&P) 500 Index over 10 weeks.
 -Referring to Table 3-11, for the week when the DJIA is high, you will expect the S&P index in that week to
(Multiple Choice)
4.7/5 (28)
TABLE 3-11
Given below are the closing prices for the Dow Jones Industrial Average (DJIA) and the Standard & Poor's (S&P) 500 Index over 10 weeks.
-Referring to Table 3-11, what is the sample correlation coefficient between the DJIA and the S&P 500 index?
(Short Answer)
4.8/5 (36)
You were told that the 1ˢᵗ, 2ⁿᵈ and 3ʳᵈ quartiles of female students' weight at a major university are 95 lbs, 125 lbs, and 138 lbs. What percentage of the students weigh between 95 and 138 lbs?
(Short Answer)
4.9/5 (42)
Filters
- Essay(0)
- Multiple Choice(0)
- Short Answer(0)
- True False(0)
- Matching(0)