Exam 3: Numerical Descriptive Measures
Exam 1: Introduction145 Questions
Exam 2: Organizing and Visualizing Data210 Questions
Exam 3: Numerical Descriptive Measures153 Questions
Exam 4: Basic Probability171 Questions
Exam 5: Discrete Probability Distributions218 Questions
Exam 6: The Normal Distribution and Other Continuous Distributions191 Questions
Exam 7: Sampling and Sampling Distributions197 Questions
Exam 8: Confidence Interval Estimation196 Questions
Exam 9: Fundamentals of Hypothesis Testing: One-Sample Tests165 Questions
Exam 10: Two-Sample Tests210 Questions
Exam 11: Analysis of Variance213 Questions
Exam 12: Chi-Square Tests and Nonparametric Tests201 Questions
Exam 13: Simple Linear Regression213 Questions
Exam 14: Introduction to Multiple Regression355 Questions
Exam 15: Multiple Regression Model Building96 Questions
Exam 16: Time-Series Forecasting168 Questions
Exam 17: Statistical Applications in Quality Management133 Questions
Exam 18: A Roadmap for Analyzing Data54 Questions
Exam 19: Questions that Involve Online Topics321 Questions
Select questions type
The line drawn within the box of the boxplot always represents the median.
(True/False)
4.9/5  (43)
(43)
TABLE 3-2
The data below represent the amount of grams of carbohydrates in a serving of breakfast cereal in a sample of 11 different servings.
11 15 23 29 19 22 21 20 15 25 17
-Referring to Table 3-2, the range in the carbohydrate amounts is ________ grams.
(Short Answer)
4.9/5 (39)
TABLE 3-12
Given below are the rating and performance scores of 15 laptop computers.
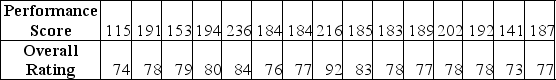 -Referring to Table 3-12, how will you classify the linear relationship between the performance scores and the rating?
(Multiple Choice)
4.9/5 (39)
According to the empirical rule, if the data form a "bell-shaped" normal distribution, ________ percent of the observations will be contained within 3 standard deviations around the arithmetic mean.
(Multiple Choice)
4.9/5 (36)
TABLE 3-3
The ordered array below represents the number of vitamin supplements sold by a health food store in a sample of 16 days.
19, 19, 20, 20, 22, 23, 25, 26, 27, 30, 33, 34, 35, 36, 38, 41
Note: For this sample, the sum of the values is 448, and the sum of the squared differences between each value and the mean is 812.
-Referring to Table 3-3, the coefficient of variation of the number of vitamin supplements sold in this sample is ________ percent.
(Short Answer)
5.0/5 (38)
TABLE 3-11
Given below are the closing prices for the Dow Jones Industrial Average (DJIA) and the Standard & Poor's (S&P) 500 Index over 10 weeks.
 -Referring to Table 3-11, you will expect an increase in the DJIA to be associated with
(Multiple Choice)
4.9/5 (36)
TABLE 3-1
Health care issues are receiving much attention in both academic and political arenas. A sociologist recently conducted a survey of citizens over 60 years of age whose net worth is too high to qualify for Medicaid. The ages of 25 senior citizens were as follows:  -Referring to Table 3-1, identify which of the following is the correct statement.
(Multiple Choice)
4.8/5 (34)
Data on the change in the cost of tuition, a shared dormitory room, and the most popular meal plan from one academic year to the next academic year for a sample of 100 public universities are collected. Below is the boxplot for the change in cost in dollars. The distribution of the change in cost is 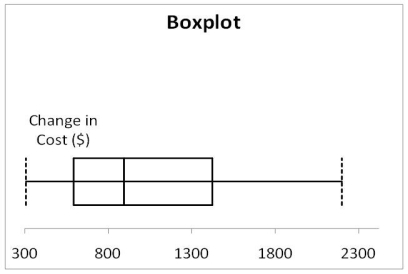
(Multiple Choice)
4.7/5 (41)
You were told that the 1ˢᵗ, 2ⁿᵈ and 3ʳᵈ quartiles of female students' weight at a major university are 95 lbs, 125 lbs, and 138 lbs. What percentage of the students weigh more than 138 lbs?
(Short Answer)
4.8/5 (42)
The geometric mean is useful in measuring the rate of change of a variable over time.
(True/False)
4.9/5 (37)
TABLE 3-12
Given below are the rating and performance scores of 15 laptop computers.
-Referring to Table 3-12, you will expect a decrease in the performance score of one laptop computer to be associated with
(Multiple Choice)
4.7/5 (37)
TABLE 3-4
The ordered array below represents the number of cargo manifests approved by customs inspectors of the Port of New York in a sample of 35 days:
16, 17, 18, 18, 19, 20, 20, 21, 21, 21, 22, 22, 22, 22, 23, 23, 23, 23, 24, 24, 24, 25, 25, 26, 26, 26, 27, 28, 28, 29, 29, 31, 31, 32, 32
Note: For this sample, the sum of the values is 838, and the sum of the squared differences between each value and the mean is 619.89.
-Referring to Table 3-4, the first quartile of the customs data is ________.
(Short Answer)
4.9/5 (38)
Which of the following statements about the median is not true?
(Multiple Choice)
4.8/5 (35)
TABLE 3-3
The ordered array below represents the number of vitamin supplements sold by a health food store in a sample of 16 days.
19, 19, 20, 20, 22, 23, 25, 26, 27, 30, 33, 34, 35, 36, 38, 41
Note: For this sample, the sum of the values is 448, and the sum of the squared differences between each value and the mean is 812.
-Referring to Table 3-3, construct a boxplot for the data in this sample.
(Essay)
4.8/5 (33)
TABLE 3-8
The time period from 2006 to 2009 saw a great deal of volatility in the value of stocks. The data in the following table represent the total rate of return of our companies from 2006 to 2009.
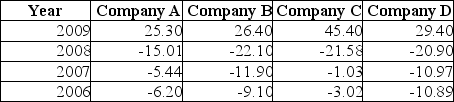 -Referring to Table 3-8, calculate the geometric mean rate of return per year for Company C.
(Short Answer)
5.0/5 (37)
TABLE 3-7
In a recent academic year, many public universities in the United States raised tuition and fees due to a decrease in state subsidies. The change in the cost of tuition, a shared dormitory room, and the most popular meal plan from the previous academic year for a sample of 10 public universities were as follows: $1,589, $593, $1,223, $869, $423, $1,720, $708, $1425, $922 and $308.
-Referring to Table 3-7, what is the five-number summary of the change in the cost?
(Essay)
4.9/5 (40)
In a set of numerical data, the value for Q₂ is always halfway between Q₁ and Q₃.
(True/False)
4.9/5 (40)
In exploratory data analysis, a boxplot can be used to illustrate the median, quartiles, and extreme values.
(True/False)
4.8/5 (43)
Filters
- Essay(0)
- Multiple Choice(0)
- Short Answer(0)
- True False(0)
- Matching(0)