Exam 17: Statistical Applications in Quality Management
Exam 1: Introduction145 Questions
Exam 2: Organizing and Visualizing Data210 Questions
Exam 3: Numerical Descriptive Measures153 Questions
Exam 4: Basic Probability171 Questions
Exam 5: Discrete Probability Distributions218 Questions
Exam 6: The Normal Distribution and Other Continuous Distributions191 Questions
Exam 7: Sampling and Sampling Distributions197 Questions
Exam 8: Confidence Interval Estimation196 Questions
Exam 9: Fundamentals of Hypothesis Testing: One-Sample Tests165 Questions
Exam 10: Two-Sample Tests210 Questions
Exam 11: Analysis of Variance213 Questions
Exam 12: Chi-Square Tests and Nonparametric Tests201 Questions
Exam 13: Simple Linear Regression213 Questions
Exam 14: Introduction to Multiple Regression355 Questions
Exam 15: Multiple Regression Model Building96 Questions
Exam 16: Time-Series Forecasting168 Questions
Exam 17: Statistical Applications in Quality Management133 Questions
Exam 18: A Roadmap for Analyzing Data54 Questions
Exam 19: Questions that Involve Online Topics321 Questions
Select questions type
Referring to Table 17-4, suppose the supervisor constructs an  chart to see if the process is in-control. Which expression best describes this chart?
(Multiple Choice)
4.8/5  (33)
(33)
Once the control limits are set for a control chart, one attempts to
(Multiple Choice)
4.9/5 (32)
TABLE 17-9
The manufacturer of canned food constructed control charts and analyzed several quality characteristics. One characteristic of interest is the weight of the filled cans. The lower specification limit for weight is 2.95 pounds. The table below provides the range and mean of the weights of five cans tested every fifteen minutes during a day's production.
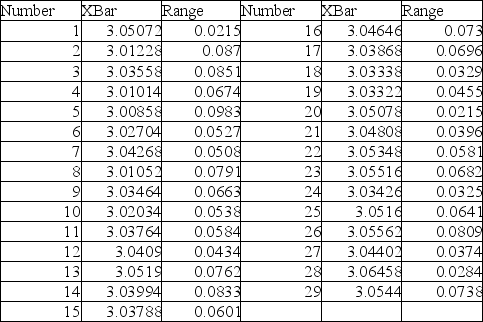 -Referring to Table 17-9, construct an R chart for the time required to register.
(Essay)
4.8/5 (34)
TABLE 17-6
The maker of a packaged candy wants to evaluate the quality of her production process. On each of 16 consecutive days, she samples 600 bags of candy and determines the number in each day's sample that she considers to be of poor quality. The data that she developed follow. 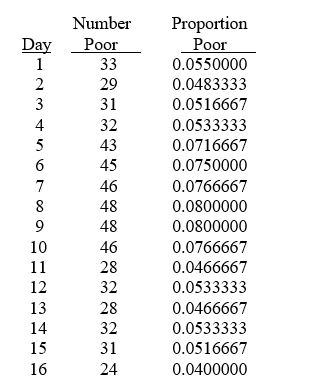 -Referring to Table 17-6, the estimate of the proportion of poor quality bags of candy is ________.
(Short Answer)
4.9/5 (35)
Referring to Table 17-7, an  chart is to be used for the number of blemishes. One way to obtain the control limits is to take the grand mean and add and subtract the product of A₂ times the mean of the sample ranges. For this data set, the value of A₂ is ________.
(Short Answer)
4.8/5 (36)
TABLE 17-5
A manufacturer of computer disks took samples of 240 disks on 15 consecutive days. The number of disks with bad sectors was determined for each of these samples. The results are in the table that follows. 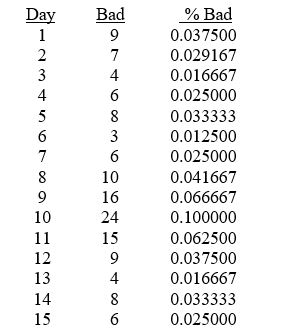 -Referring to Table 17-5, the process seems to be in control.
(True/False)
4.8/5 (32)
Which of the following is not part of the DMAIC process in Six Sigma management?
(Multiple Choice)
4.9/5 (47)
Cp > 1 indicates that if the process average can be centered, then more than 99.73% of the observations will fall inside the specification limits.
(True/False)
5.0/5 (40)
Referring to Table 17-7, based on the  chart for the number of blemishes, it appears that the process is out of control.
(True/False)
5.0/5 (40)
TABLE 17-10
Below is the number of defective items from a production line over twenty consecutive morning shifts.
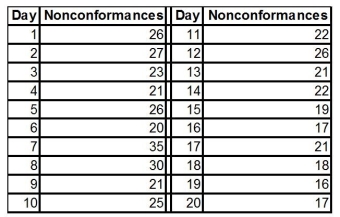 -Referring to Table 17-10, construct a c chart for the number of defective items.
(Essay)
4.9/5 (36)
In the United States, the control limits on a control chart are placed so that they are 3 standard deviations above and below a central line.
(True/False)
4.8/5 (34)
TABLE 17-5
A manufacturer of computer disks took samples of 240 disks on 15 consecutive days. The number of disks with bad sectors was determined for each of these samples. The results are in the table that follows.
-Referring to Table 17-5, a p control chart is to be made for these data. The upper control limit is ________, and the lower control limit is ________.
(Short Answer)
4.8/5 (38)
Maintaining the gains that have been made with a revised process in the long term by avoiding potential problems that can occur when a process is changed involves which part of the DMAIC process?
(Multiple Choice)
4.7/5 (35)
Filters
- Essay(0)
- Multiple Choice(0)
- Short Answer(0)
- True False(0)
- Matching(0)