Exam 6: Antiderivatives and Applications
Exam 1: Functions and Change204 Questions
Exam 2: Rate of Change: the Derivative132 Questions
Exam 3: Shortcuts to Differentiation178 Questions
Exam 4: Using the Derivative94 Questions
Exam 5: Accumulated Change: the Definite Integral93 Questions
Exam 6: Antiderivatives and Applications122 Questions
Exam 7: Probability68 Questions
Exam 8: Functions of Several Variables134 Questions
Exam 9: Mathematical Modeling Using Differential Equations121 Questions
Exam 10: Geometric Series65 Questions
Select questions type
Given the following graph of  and the fact that
  , what is x = 100?
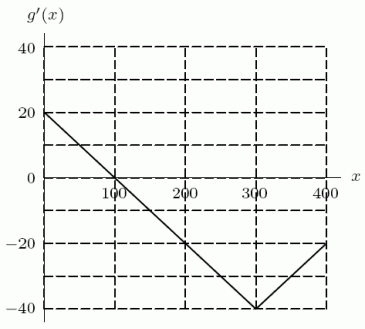
(Multiple Choice)
4.9/5  (36)
(36)
Use a definite integral to find the area under the graph of 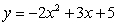 between
  and
and  . Round to 2 decimal places.
(Short Answer)
4.9/5 (31)
Choose the function that would correspond to this graph of F'. 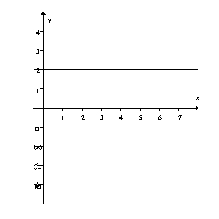
(Multiple Choice)
4.8/5 (39)
Propellant is leaking out from the pressurized fuel tanks of the space shuttle, causing the pressure to decrease at a rate of  psi per second at time t in seconds. By how many psi has the pressure dropped during the first 30 seconds? Round to 2 decimal places.
(Short Answer)
4.9/5 (40)
Supply and demand curves for a product are given by the equations
Demand: 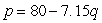 Supply:
  where p is price in dollars and q is quantity. Find the equilibrium price.
(Short Answer)
4.7/5 (38)
Supply and demand data are given in the following tables. 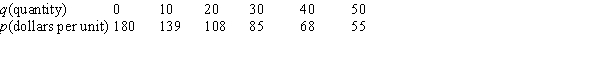
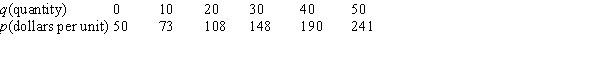 Estimate the consumer surplus.
(Short Answer)
4.9/5 (41)
Find a possible antiderivative of  , where a and b are constants.
(Multiple Choice)
4.8/5 (41)
The following figure shows the demand and supply curves for a product. Estimate the equilibrium quantity. 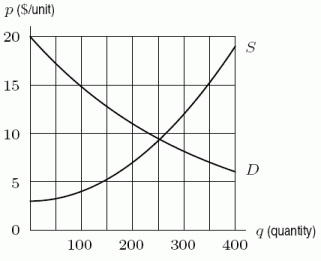
(Multiple Choice)
4.9/5 (32)
A young couple wants to start a family in five years time. They plan to add an addition to their home in four years so it is ready when they start their family. They estimate that $ 130,000 will be needed in four years. They can earn 8% on an investment now. If the couple makes one lump sum deposit now in order to have $ 130,000 in four years, how much should they deposit.
(Multiple Choice)
4.8/5 (43)
This figure shows the rate of change of F. 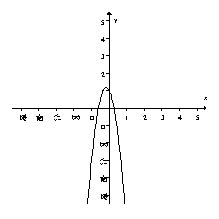 Given that F(0) = 2, sketch the graph of F.
(Short Answer)
4.7/5 (32)
A. Find the present value of an income stream of $1000 per year for a period of 5 years if the interest rate is 8%. Round to the nearest dollar.
B. Find the future value of this income stream. Round to the nearest dollar.
(Short Answer)
4.7/5 (37)
Filters
- Essay(0)
- Multiple Choice(0)
- Short Answer(0)
- True False(0)
- Matching(0)