Exam 6: Antiderivatives and Applications
Exam 1: Functions and Change204 Questions
Exam 2: Rate of Change: the Derivative132 Questions
Exam 3: Shortcuts to Differentiation178 Questions
Exam 4: Using the Derivative94 Questions
Exam 5: Accumulated Change: the Definite Integral93 Questions
Exam 6: Antiderivatives and Applications122 Questions
Exam 7: Probability68 Questions
Exam 8: Functions of Several Variables134 Questions
Exam 9: Mathematical Modeling Using Differential Equations121 Questions
Exam 10: Geometric Series65 Questions
Select questions type
The following graph represents the rate of change of a function f with respect to x; i.e., it is the graph of  , with
  . Find a value a to one decimal place such that
  and
and  . If there is no such value, enter "none".
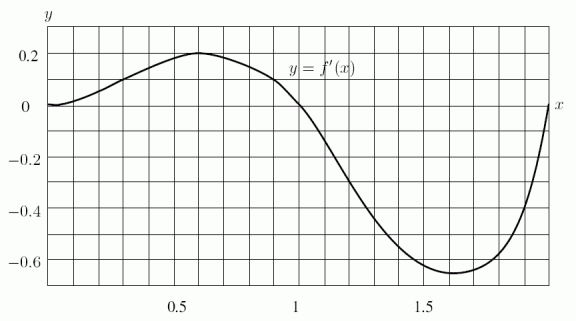
(Short Answer)
4.9/5  (31)
(31)
A family invests in a snow cone stand that has an annual income of $10,000. If they plan to keep the stand for 10 years and save all of the income in an account earning 4.5% interest, compounded continuously, what will their total savings be?
(Short Answer)
4.8/5 (34)
Supply and demand curves for a product are shown in the following figure. Suppose an artificially low price of $300 is imposed. Estimate the total gains from trade now, to the nearest 500 dollars. 
(Short Answer)
4.8/5 (27)
From the time a child is born until he is 18, a father plans to set aside $100 times the child's current age each year. Find the present value of this income stream, given an interest rate of 7% compounded continuously. Round to the nearest dollar.
(Short Answer)
4.8/5 (46)
Consider  . What is the definite integral obtained after making the substitution
  ?
?
(Multiple Choice)
5.0/5 (44)
Given the following graph of  and the fact that
  , determine whether
  is positive or negative.
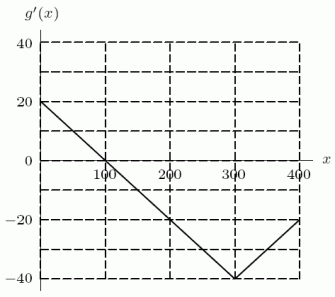
(Short Answer)
4.8/5 (46)
Supply and demand curves for a product are shown in the following figure. Estimate the consumer surplus, to the nearest thousand dollars. 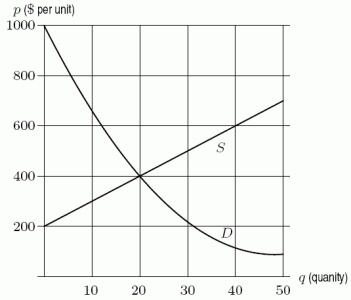
(Short Answer)
4.9/5 (33)
The following figure shows the demand and supply curves for a product. At an artificially imposed price of $14, what quantity will consumers buy? 
(Multiple Choice)
4.8/5 (42)
The demand curve for a product has equation  , and the supply curve has equation
  for
for  , where q is quantity and p is the price per unit. At an artificially high price of $27, find the quantity consumers are willing to purchase and the quantity producers are willing to supply. Use this information to calculate the producer surplus at this price, to the nearest dollar.
(Short Answer)
4.9/5 (32)
Which of the following are appropriate for integration by substitution? (Check all that apply.)
(Multiple Choice)
4.9/5 (39)
The following figure shows the demand and supply curves for a product. At an artificially imposed price of $12, estimate the consumer surplus. 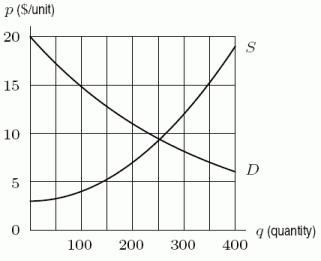
(Multiple Choice)
4.9/5 (41)
Filters
- Essay(0)
- Multiple Choice(0)
- Short Answer(0)
- True False(0)
- Matching(0)