Exam 6: Antiderivatives and Applications
Exam 1: Functions and Change204 Questions
Exam 2: Rate of Change: the Derivative132 Questions
Exam 3: Shortcuts to Differentiation178 Questions
Exam 4: Using the Derivative94 Questions
Exam 5: Accumulated Change: the Definite Integral93 Questions
Exam 6: Antiderivatives and Applications122 Questions
Exam 7: Probability68 Questions
Exam 8: Functions of Several Variables134 Questions
Exam 9: Mathematical Modeling Using Differential Equations121 Questions
Exam 10: Geometric Series65 Questions
Select questions type
Use integration by parts to find  . (Give the exact answer in terms of natural logs.)
Free
(Short Answer)
4.7/5  (41)
(41)
Correct Answer: Verified
The following figure is a graph of  . On which of the following intervals is f decreasing?
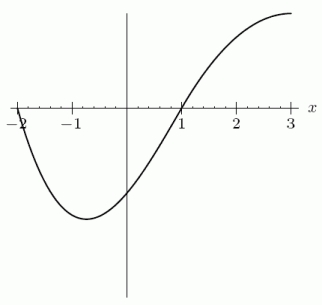
Free
(Multiple Choice)
4.9/5 (33)
Correct Answer:Verified
A
Fuel pressure in the fuel tanks of the space shuttle is decreasing at a rate of  psi per second at time t in seconds. By how many total psi has the pressure decreased during the first minute? Round to 2 decimal places.
(Short Answer)
4.9/5 (35)
Your company is downsizing and offers you a bonus if you retire early. You have a choice between a lump sum of $52,000 now or an income stream of $6200 per year for 10 years. You plan to use the money for a trip around the world in 10 years. You can earn interest at a continuous rate of 4%. Which option would be the better choice, and how much will you have for your trip?
(Short Answer)
4.7/5 (39)
Use the Fundamental Theorem of Calculus to determine the value of b if the area under the graph of  between
  and
and  is 8. Assume
  .
.
(Short Answer)
4.9/5 (35)
Given the values of  in the table and that
  , estimate
  to the nearest whole number.
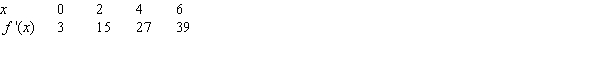
(Short Answer)
4.7/5 (35)
Supply and demand curves for a product are given by the equations
Demand: 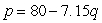 Supply:
  where p is price in dollars and q is quantity. Compute the producer surplus. Round to the nearest cent.
(Short Answer)
4.8/5 (34)
A consultant expects an income stream of $15,000 per year for the next 8 years.
A. Find the present value of this income stream if the interest rate is 2% per year, compounded continuously.
B. Find the future value of this income stream under the same conditions.
(Short Answer)
4.9/5 (37)
What is the present value of an income stream of $1000 per year for 10 years with an annual interest rate of 10%, compounded continuously? Round to the nearest dollar.
(Short Answer)
4.9/5 (35)
The supply and demand curves for a product have equations  and
and  , respectively, with equilibrium at
  . Which of the following is a formula for total gains from trade?
(Multiple Choice)
4.8/5 (34)
The following figure shows the demand and supply curves for a product. Estimate the total gains from trade. 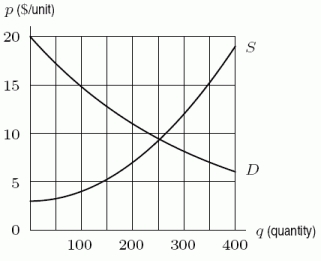
(Multiple Choice)
4.8/5 (36)
The graph of the derivative F' of a function F is shown. Assuming that F(20) = 10, estimate the maximum value attained by F. 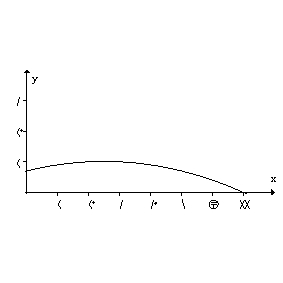
(Short Answer)
4.8/5 (32)
Filters
- Essay(0)
- Multiple Choice(0)
- Short Answer(0)
- True False(0)
- Matching(0)