Exam 18: Statistical Quality Control
Exam 1: Introduction to Statistics130 Questions
Exam 2: Charts and Graphs94 Questions
Exam 3: Descriptive Statistics105 Questions
Exam 4: Probability122 Questions
Exam 5: Discrete Distributions75 Questions
Exam 6: Continuous Distributions107 Questions
Exam 7: Sampling and Sampling Distributions101 Questions
Exam 8: Statistical Inference: Estimation for Single Populations75 Questions
Exam 9: Statistical Inference: Hypothesis Testing for Single Populations73 Questions
Exam 10: Statistical Inferences About Two Populations73 Questions
Exam 11: Analysis of Variance and Design of Experiments75 Questions
Exam 12: Simple Regression Analysis and Correlation75 Questions
Exam 13: Multiple Regression Analysis75 Questions
Exam 14: Building Multiple Regression Models75 Questions
Exam 15: Time-Series Forecasting and Index Numbers74 Questions
Exam 16: Analysis of Categorical Data74 Questions
Exam 17: Nonparametric Statistics79 Questions
Exam 18: Statistical Quality Control75 Questions
Exam 19: Decision Analysis77 Questions
Select questions type
A p chart used for statistical quality control is a chart that shows the probability distribution of defectives in the process output.
Free
(True/False)
4.8/5  (40)
(40)
Correct Answer: Verified
False
A graph which plots the number of nonconformances per item for multiple samples is called a (n)___.
Free
(Multiple Choice)
4.8/5 (34)
Correct Answer:Verified
D
Quality control is essentially final inspection of the products to ensure that no defectives are shipped out.
Free
(True/False)
4.8/5 (41)
Correct Answer:Verified
False
According to Garvin, transcendent quality implies that a product ___.
(Multiple Choice)
4.8/5 (36)
Sarah Soliz, Director of Quality Programs, is designing  and R charts for the rod shearing process at Stockton Steel.She has 26 samples of rod length, and each sample included measurements of 5 rods.The mean of the 26 sample means is 112 centimetres, and mean of the 26 ranges is 0.15 centimetres.The centerline for her R chart is ___.
(Multiple Choice)
4.9/5 (34)
According to the following Pareto chart, the most common defect was ___. 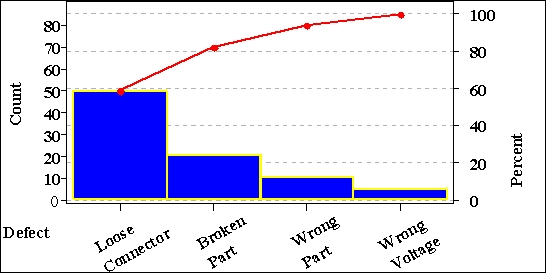
(Multiple Choice)
4.9/5 (36)
Which of the following quality control chart conditions is an indicator that the process is potentially out-of-control?
(Multiple Choice)
4.7/5 (33)
A schematic representation of all the activities and interactions that occur in a process is called a Pareto chart.
(True/False)
4.7/5 (43)
Say a manufacturer maintains a control chart of the overall product process and determines that the process is out of control too often across all shifts.Managers could most effectively start to determine potential causes by creating a ______________.
(Multiple Choice)
4.8/5 (37)
In many public restrooms, management will keep a sheet on the back of the door noting the times that the restroom is to be cleaned as the column headings and each row denoting a step of the cleaning to be completed.This would be an example of a __________.
(Multiple Choice)
4.9/5 (40)
Working from a Pareto chart, a company wants to address the two most common causes of interruptions in the company's production process.Managers should focus on the _____________ of the chart.
(Multiple Choice)
4.9/5 (27)
A p chart is to be developed for use in quality control.The value of p is calculated to be 0.04.The sample size is 100.What would the upper control limit be?
(Multiple Choice)
4.7/5 (30)
Inspecting the attributes of a finished product to determine whether the product is acceptable, is in need of rework, or is to be rejected is called after-process quality control.
(True/False)
4.7/5 (33)
Pareto chart is a diagnostic tool that displays possible causes of a quality problem and the interrelationships among the causes.
(True/False)
4.8/5 (40)
Higher output wattage means higher quality to some consumers of audio amplifiers.Among Garvin's five quality types, this is an example of ___.
(Multiple Choice)
4.9/5 (37)
A histogram is often used by researchers to gain a(n)_______________ of the data.
(Multiple Choice)
5.0/5 (37)
Inspecting the attributes of a finished product to determine whether the product is acceptable, is in need of rework, or is to be rejected is called in-process quality control.
(True/False)
4.8/5 (29)
Sarah Soliz, Director of Quality Programs, is designing  and R charts for the rod shearing process at Stockton Steel.She has 26 samples of rod length, and each sample included measurements of 5 rods.The mean of the 26 sample means is 112 centimetres, and mean of the 26 ranges is 0.15 centimetres.The lower control limit for her
  chart is ___.
(Multiple Choice)
4.9/5 (38)
Filters
- Essay(0)
- Multiple Choice(0)
- Short Answer(0)
- True False(0)
- Matching(0)